Set up docs MCP
사전 요구 사항:
- ClickHouse 구성 파일에 대한 이해
- 실행 중인 ClickHouse 서버
- (선택 사항) 실행 중인 로컬 Grafana 인스턴스
[object Object]
config.xml의 opentelemetry_span_log 섹션을 수정한 적이 없다면 이 단계는 건너뛰어도 됩니다.
기본 ClickHouse config.xml 파일을 열고 다음 섹션을 찾으십시오:
<!--
    OpenTelemetry log contains OpenTelemetry trace spans.

    NOTE: this table does not use standard schema with event_date and event_time!
-->
<opentelemetry_span_log>
    <!--
        The default table creation code is insufficient, this <engine> spec
        is a workaround. There is no 'event_time' for this log, but two times,
        start and finish. It is sorted by finish time, to avoid inserting
        data too far away in the past (probably we can sometimes insert a span
        that is seconds earlier than the last span in the table, due to a race
        between several spans inserted in parallel). This gives the spans a
        global order that we can use to e.g. retry insertion into some external
        system.
    -->
    <engine>
        engine MergeTree
        partition by toYYYYMM(finish_date)
        order by (finish_date, finish_time_us, trace_id)
    </engine>
    <database>system</database>
    <table>opentelemetry_span_log</table>
    <flush_interval_milliseconds>7500</flush_interval_milliseconds>
    <max_size_rows>1048576</max_size_rows>
    <reserved_size_rows>8192</reserved_size_rows>
    <buffer_size_rows_flush_threshold>524288</buffer_size_rows_flush_threshold>
    <flush_on_crash>false</flush_on_crash>
</opentelemetry_span_log>
주석 처리되어 있지 않은지 확인하십시오. 그렇지 않으면 다음 단계에서 system.opentelemetry_span_log를 볼 수 없습니다.
ClickHouse 서버가 기본 설정 파일을 사용하지 않는 경우에도 이런 현상이 발생할 수 있습니다.
다음과 유사한 내용이 있는지 서버 로그를 확인하십시오:
Processing configuration file 'config.xml'.
There is no file 'config.xml', will use embedded config.OpenTelemetry 트레이싱 활성화
ClickHouse 서버가 실행 중인 상태에서 clickhouse client를 열고 다음 쿼리를 사용해 trace 수집을 활성화합니다:
SET opentelemetry_trace_processors=1;다음을 실행하면 이제 opentelemetry_span_log 시스템 테이블이 표시됩니다:
SHOW TABLES IN system다음 실행:
SET opentelemetry_start_trace_probability=1;이 설정은 ClickHouse가 실행되는 쿼리에 대해 트레이스를 시작할 확률을 지정하며,
1은 모든 실행되는 쿼리에 대해 트레이스가 활성화됨을 의미합니다.
쿼리 ID 가져오기
다음 테스트용 쿼리 또는 추적하려는 쿼리를 실행하세요:
SELECT pow(number, 2) FROM numbers(10E4);쿼리 ID를 복사하세요:
:) SELECT pow(number, 2) FROM numbers(10E4);

SELECT pow(number, 2)
FROM numbers(100000.)

Query id: a9241258-a0c4-4776-a00b-e6a1d9bec4a1
트레이스 파일 생성
다음 쿼리를 실행하되, 이전 단계에서 얻은 쿼리 ID로 바꿔 입력하십시오:
WITH 'a9241258-a0c4-4776-a00b-e6a1d9bec4a1' AS my_query_id
SELECT
    concat(substring(hostName(), length(hostName()), 1), leftPad(greatest(attribute['clickhouse.thread_id'], attribute['thread_number']), 5, '0')) AS group,
    operation_name,
    start_time_us,
    finish_time_us,
    sipHash64(operation_name) AS color,
    attribute
FROM system.opentelemetry_span_log
WHERE (trace_id IN (
    SELECT trace_id
    FROM system.opentelemetry_span_log
    WHERE (attribute['clickhouse.query_id']) = my_query_id
)) AND (operation_name != 'query') AND (operation_name NOT LIKE 'Query%')
ORDER BY
    hostName() ASC,
    group ASC,
    parent_span_id ASC,
    start_time_us ASC
INTO OUTFILE 'trace.json'
FORMAT JSON
SETTINGS output_format_json_named_tuples_as_objects = 1
이렇게 하면 trace가 trace.json 파일에 기록됩니다.
기본적으로 이 파일은 clickhouse-client 또는 clickhouse-local 도구를 실행한 현재 작업 디렉터리에 생성됩니다.
기본 제공 도구로 trace 시각화하기
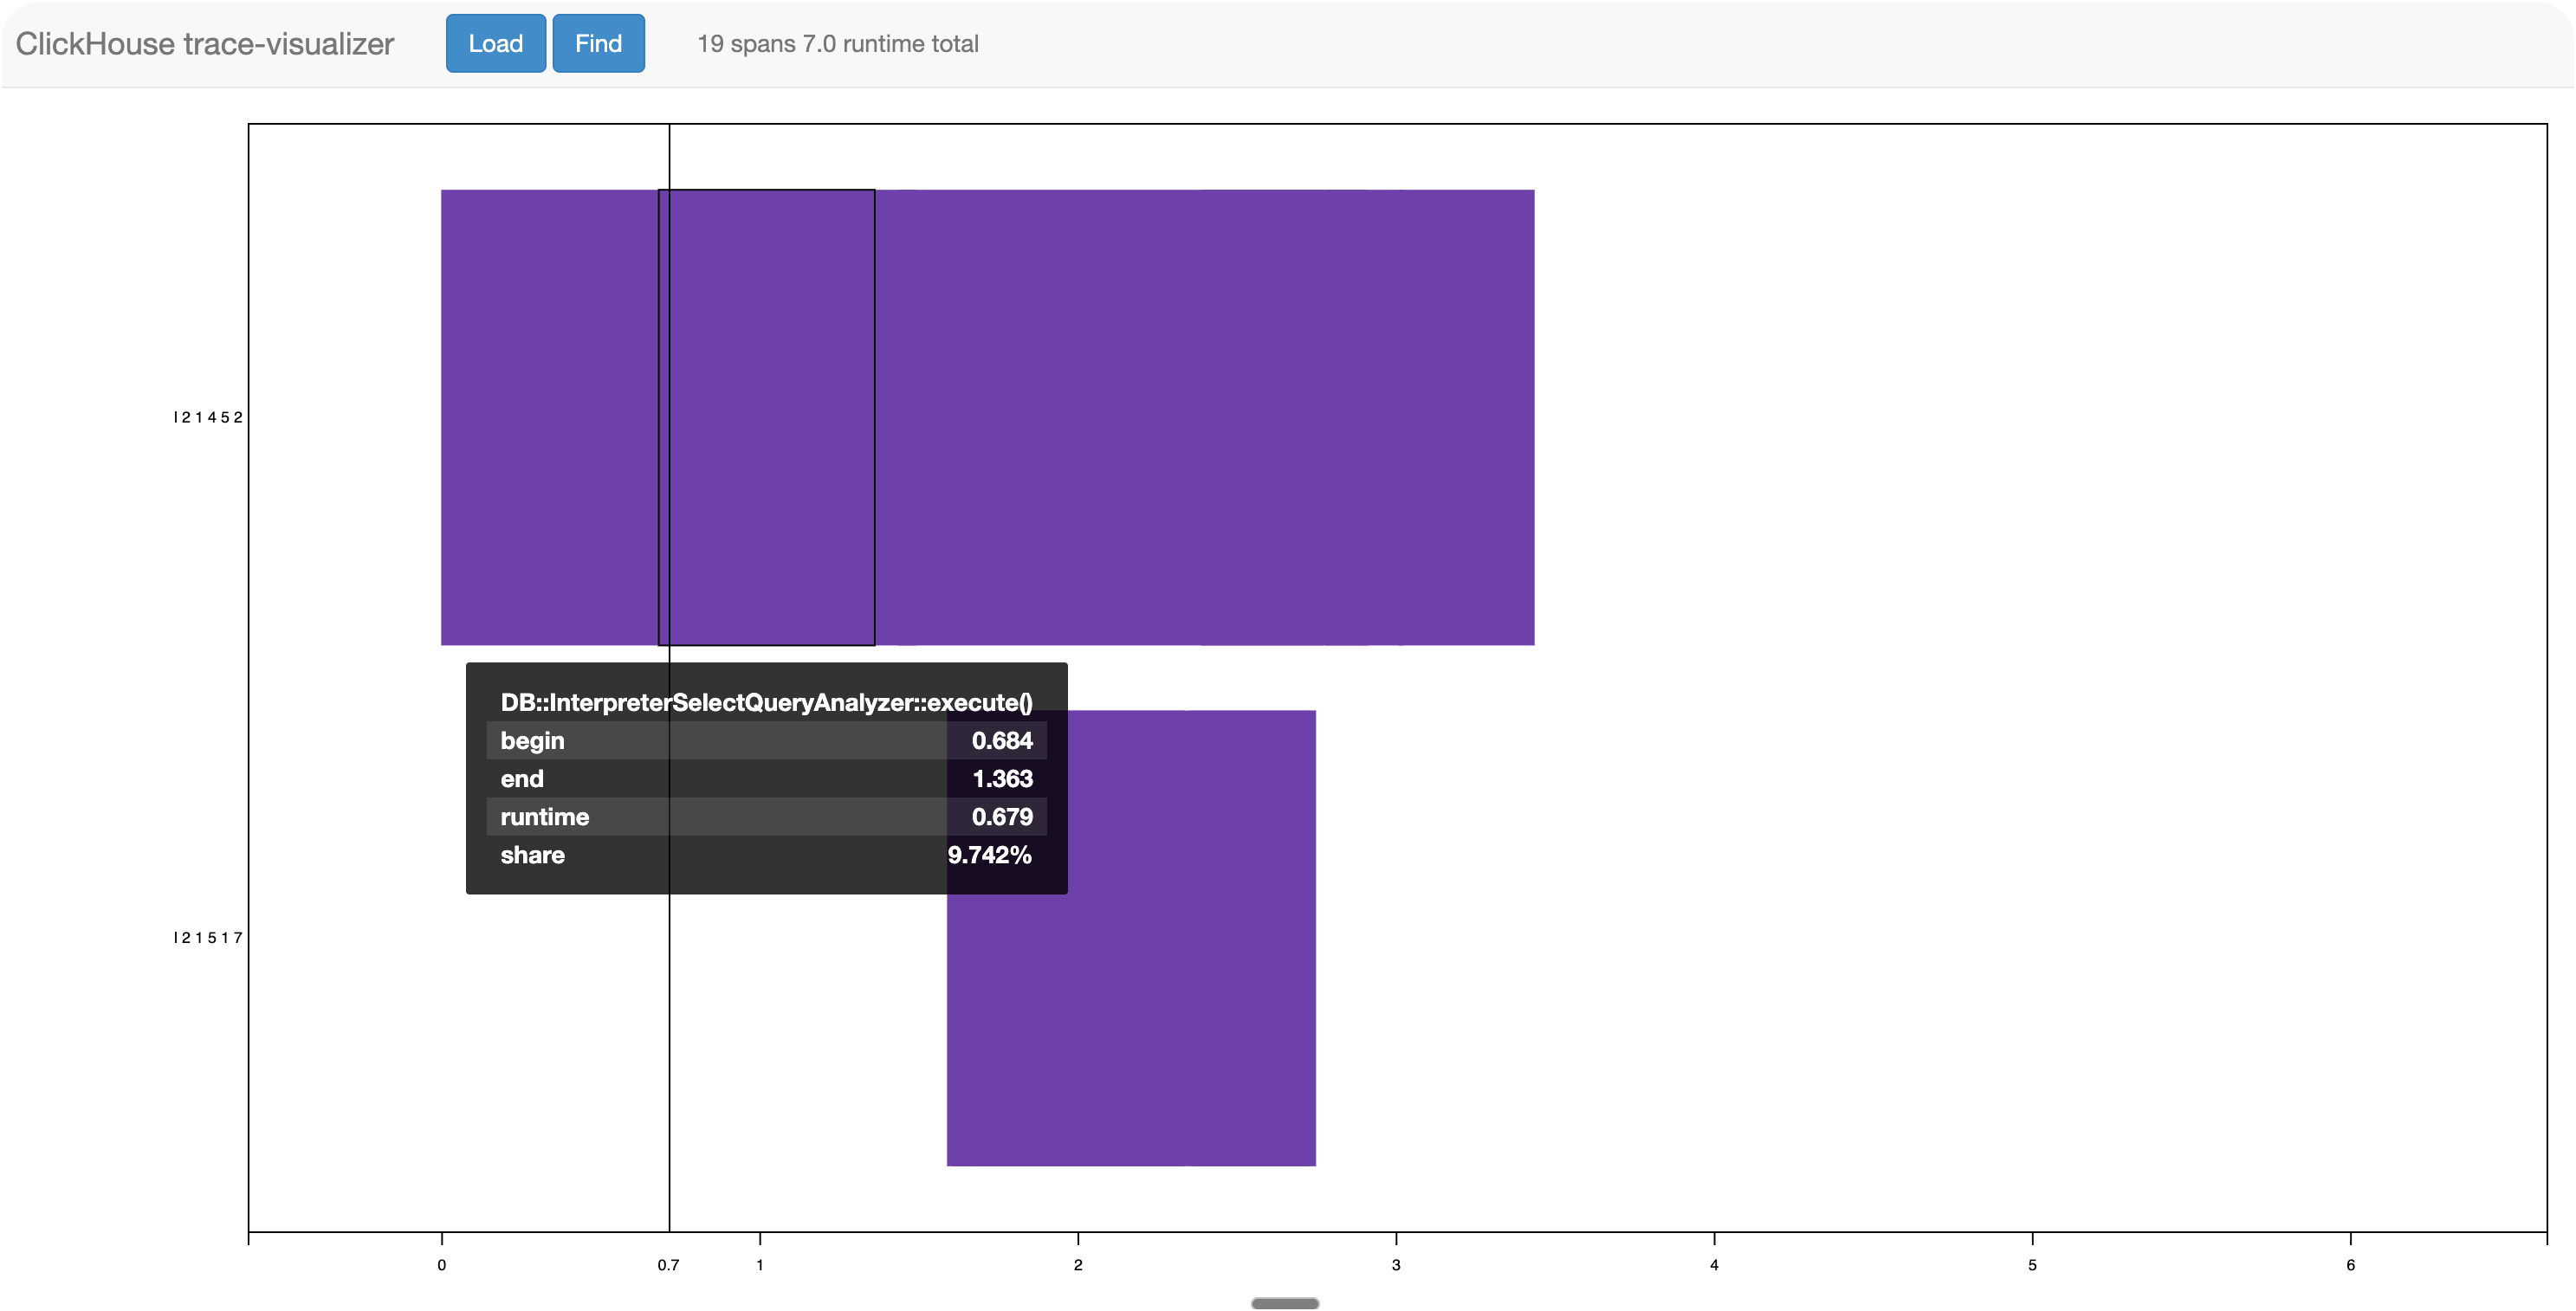
다음 호스팅된 trace 시각화 도구를 사용하십시오: https://trace-visualizer.clickhouse.com/.
이전 단계의 trace.json 파일을 불러와 trace를 시각화하십시오.
Grafana를 사용해 트레이스 시각화하기
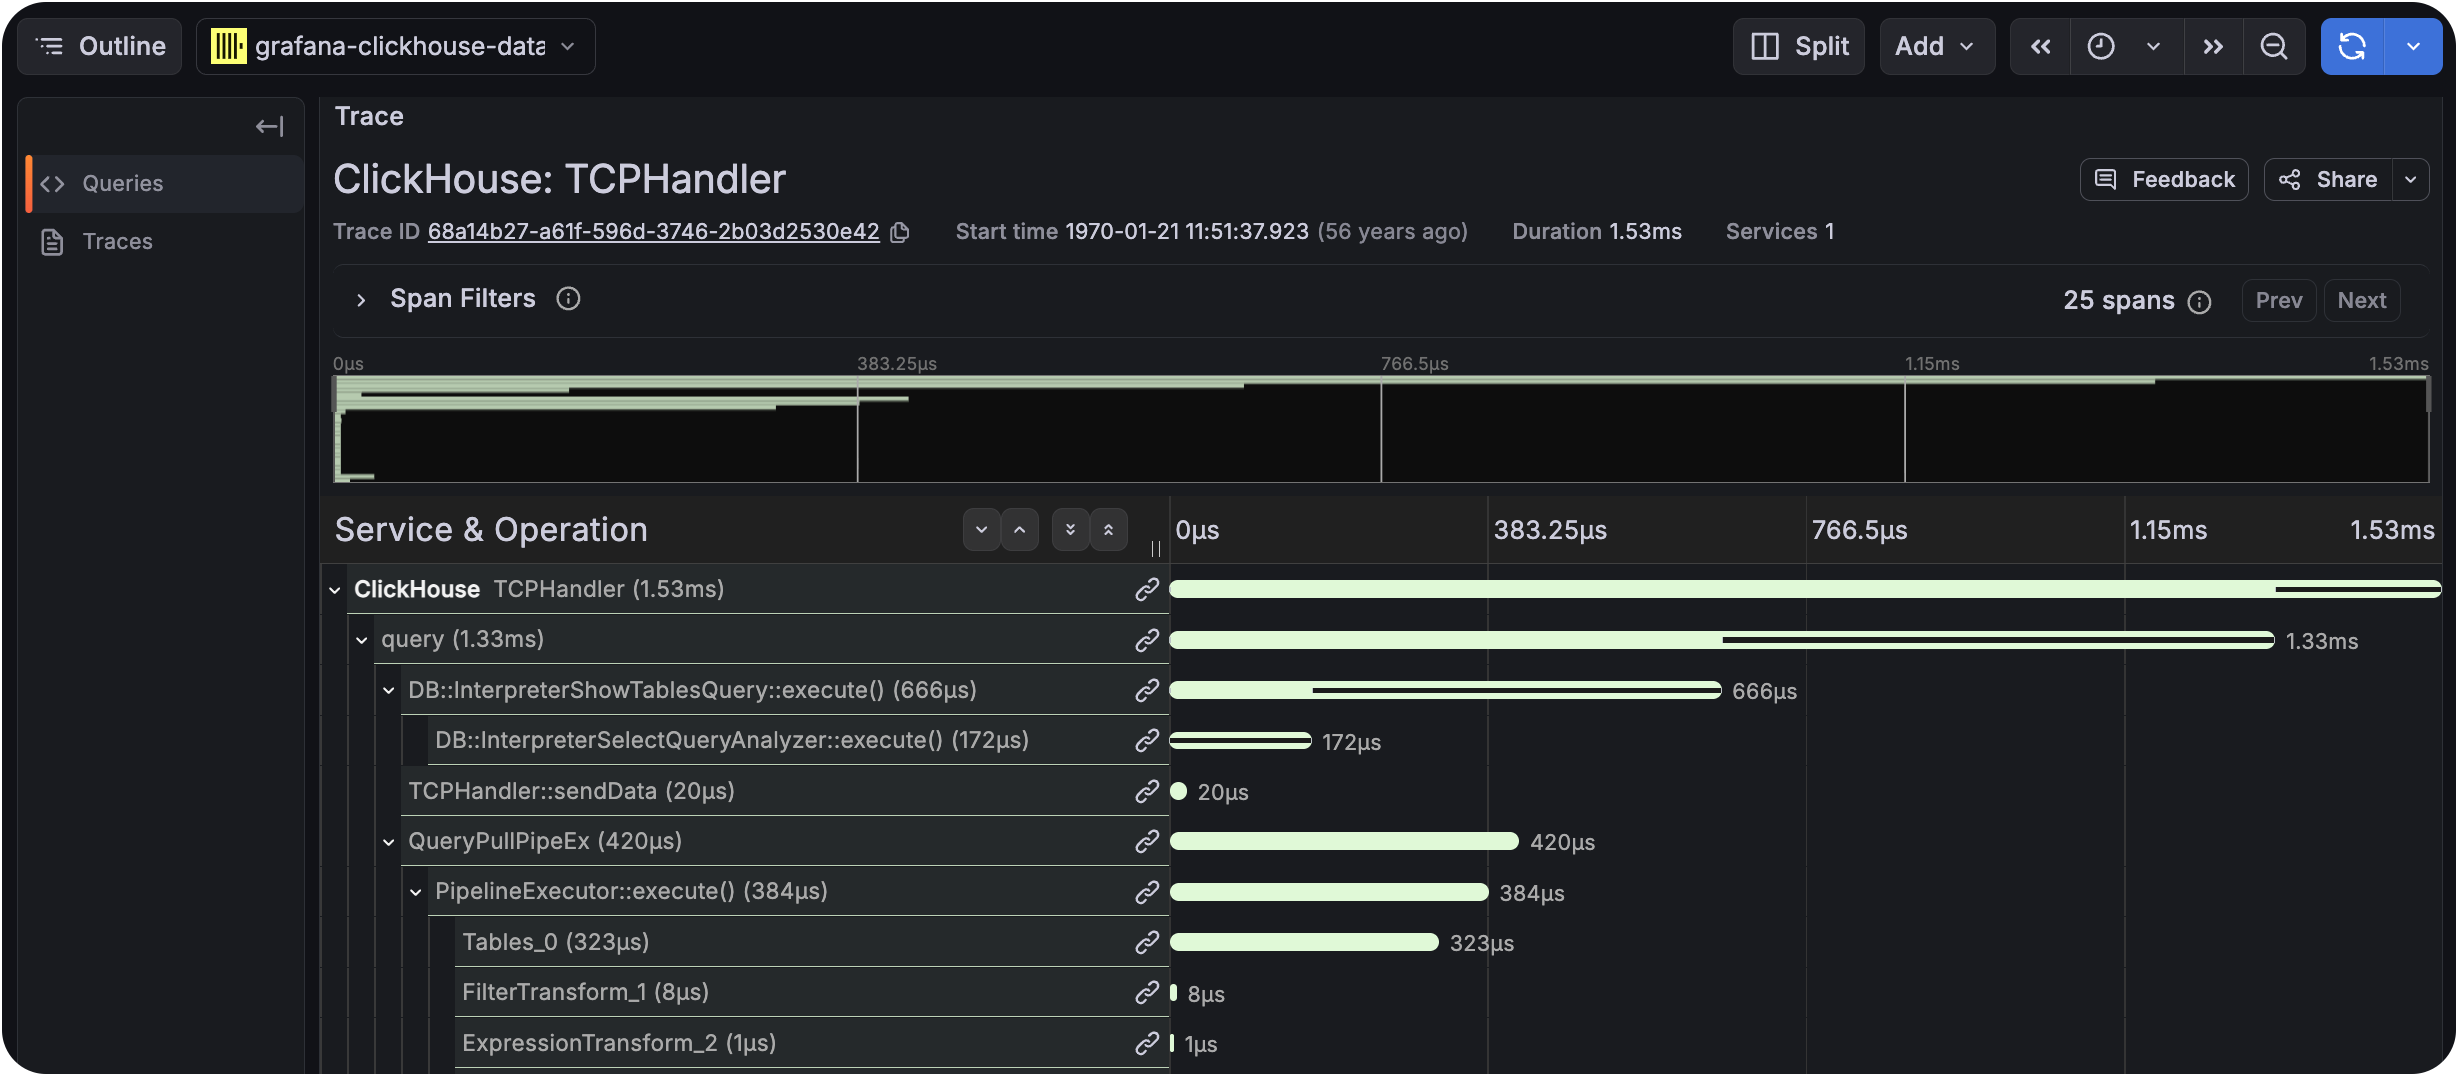
공식 ClickHouse plugin을 사용해 trace 데이터를 시각화하고 탐색하는 데는 Grafana를 권장합니다. 이 plugin은 Trace Panel을 사용해 trace를 시각화할 수 있도록 개선되었습니다. 이는 시각화와 Explore의 구성 요소로 모두 지원됩니다.
Grafana를 ClickHouse plugin과 함께 설정하려면 "관측성을 위한 Grafana 및 ClickHouse 사용"에 설명된 단계를 따르십시오.
그런 다음 Explore 탭에서 다음 쿼리를 실행할 수 있으며, trace_id를 사용자 환경에 맞게 바꾸십시오:
SELECT
    toString(trace_id) AS traceID,
    toString(span_id) AS spanID,
    if(toString(parent_span_id)='0', '', toString(parent_span_id)) AS parentSpanID,
    'ClickHouse' AS serviceName,
    operation_name AS operationName,
    start_time_us/1000000 AS startTime,
    (finish_time_us - start_time_us)/1000 AS duration,
    arrayMap(key -> map('key', key, 'value', attribute[key]), mapKeys(attribute)) AS serviceTags
FROM system.opentelemetry_span_log
WHERE trace_id = '68a14b27-a61f-596d-3746-2b03d2530e42' ORDER BY startTime ASC
Query type을 Traces로 설정하십시오:
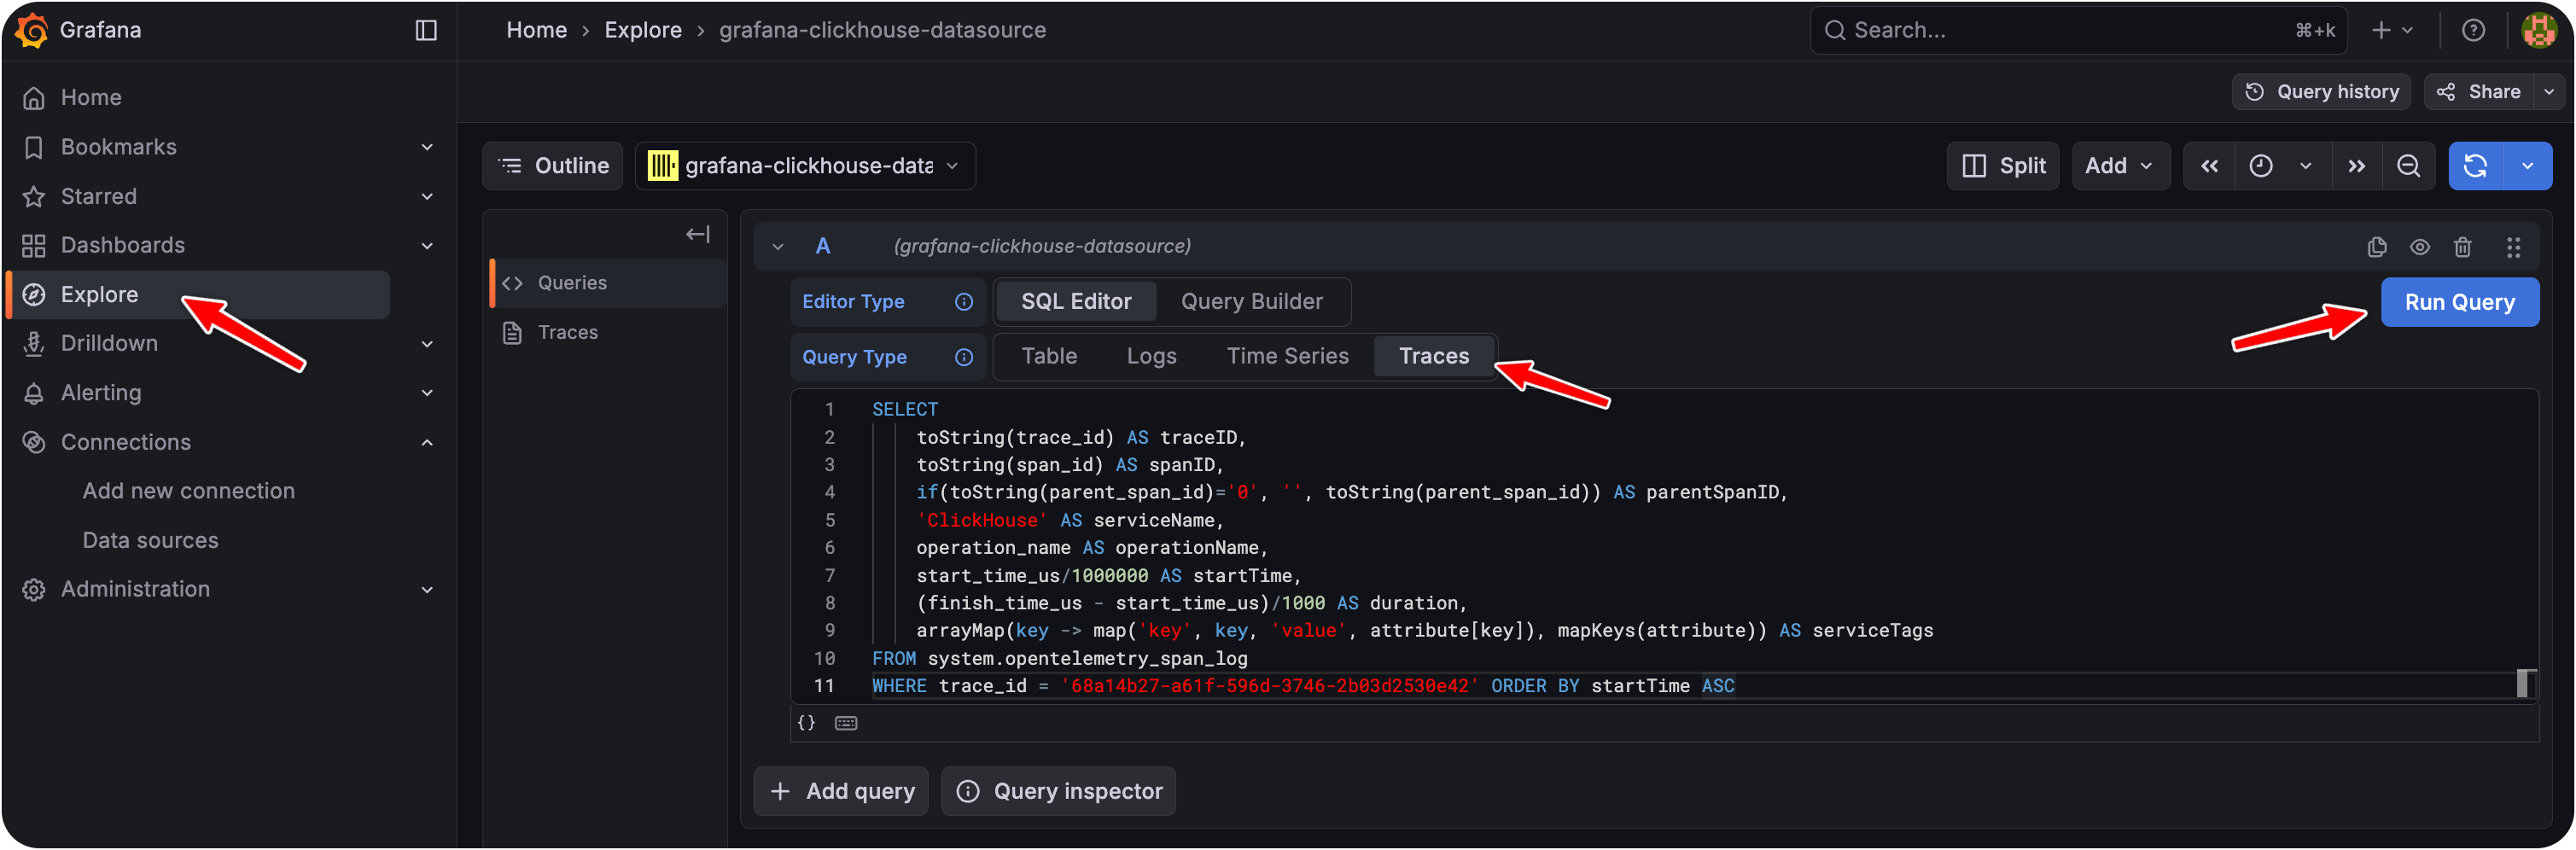
"Run Query"를 클릭한 다음 트레이스 다이어그램을 살펴보십시오: