Set up docs MCP
前置条件:
- 熟悉 ClickHouse 配置文件
- 一个正在运行的 ClickHouse server 实例
- (可选) 一个正在本地运行的 Grafana 实例
[object Object]
如果你没有修改过 config.xml 中的 opentelemetry_span_log 部分,可以跳过此步骤。
打开默认的 ClickHouse config.xml 文件,找到以下部分:
<!--
    OpenTelemetry log contains OpenTelemetry trace spans.

    NOTE: this table does not use standard schema with event_date and event_time!
-->
<opentelemetry_span_log>
    <!--
        The default table creation code is insufficient, this <engine> spec
        is a workaround. There is no 'event_time' for this log, but two times,
        start and finish. It is sorted by finish time, to avoid inserting
        data too far away in the past (probably we can sometimes insert a span
        that is seconds earlier than the last span in the table, due to a race
        between several spans inserted in parallel). This gives the spans a
        global order that we can use to e.g. retry insertion into some external
        system.
    -->
    <engine>
        engine MergeTree
        partition by toYYYYMM(finish_date)
        order by (finish_date, finish_time_us, trace_id)
    </engine>
    <database>system</database>
    <table>opentelemetry_span_log</table>
    <flush_interval_milliseconds>7500</flush_interval_milliseconds>
    <max_size_rows>1048576</max_size_rows>
    <reserved_size_rows>8192</reserved_size_rows>
    <buffer_size_rows_flush_threshold>524288</buffer_size_rows_flush_threshold>
    <flush_on_crash>false</flush_on_crash>
</opentelemetry_span_log>
请确保该项未被注释掉,否则在接下来的步骤中,你将无法看到 system.opentelemetry_span_log。
如果你的 ClickHouse server 没有使用默认配置文件,也可能会出现这种情况。
检查你的服务器日志中是否有类似以下内容:
Processing configuration file 'config.xml'.
There is no file 'config.xml', will use embedded config.启用 OpenTelemetry 链路追踪
在 ClickHouse server 运行后,打开 ClickHouse client,并使用以下查询启用 trace 采集:
SET opentelemetry_trace_processors=1;现在运行以下命令后,你应该能看到 opentelemetry_span_log 系统表:
SHOW TABLES IN system然后运行:
SET opentelemetry_start_trace_probability=1;这会设置 ClickHouse 为已执行查询启动 trace 的概率,其中
1 表示对所有已执行查询都启用 trace。
获取查询 ID
运行以下示例查询,或运行你想要跟踪的查询:
SELECT pow(number, 2) FROM numbers(10E4);复制查询 ID:
:) SELECT pow(number, 2) FROM numbers(10E4);

SELECT pow(number, 2)
FROM numbers(100000.)

Query id: a9241258-a0c4-4776-a00b-e6a1d9bec4a1
生成 trace 文件
运行以下查询,并将其中的查询 ID 替换为你在上一步获取的查询 ID:
WITH 'a9241258-a0c4-4776-a00b-e6a1d9bec4a1' AS my_query_id
SELECT
    concat(substring(hostName(), length(hostName()), 1), leftPad(greatest(attribute['clickhouse.thread_id'], attribute['thread_number']), 5, '0')) AS group,
    operation_name,
    start_time_us,
    finish_time_us,
    sipHash64(operation_name) AS color,
    attribute
FROM system.opentelemetry_span_log
WHERE (trace_id IN (
    SELECT trace_id
    FROM system.opentelemetry_span_log
    WHERE (attribute['clickhouse.query_id']) = my_query_id
)) AND (operation_name != 'query') AND (operation_name NOT LIKE 'Query%')
ORDER BY
    hostName() ASC,
    group ASC,
    parent_span_id ASC,
    start_time_us ASC
INTO OUTFILE 'trace.json'
FORMAT JSON
SETTINGS output_format_json_named_tuples_as_objects = 1
这会将 trace 写入名为 trace.json 的文件。
默认情况下,该文件会创建在你运行 clickhouse-client 或 clickhouse-local 工具时的当前工作目录中。
使用内置工具可视化 trace
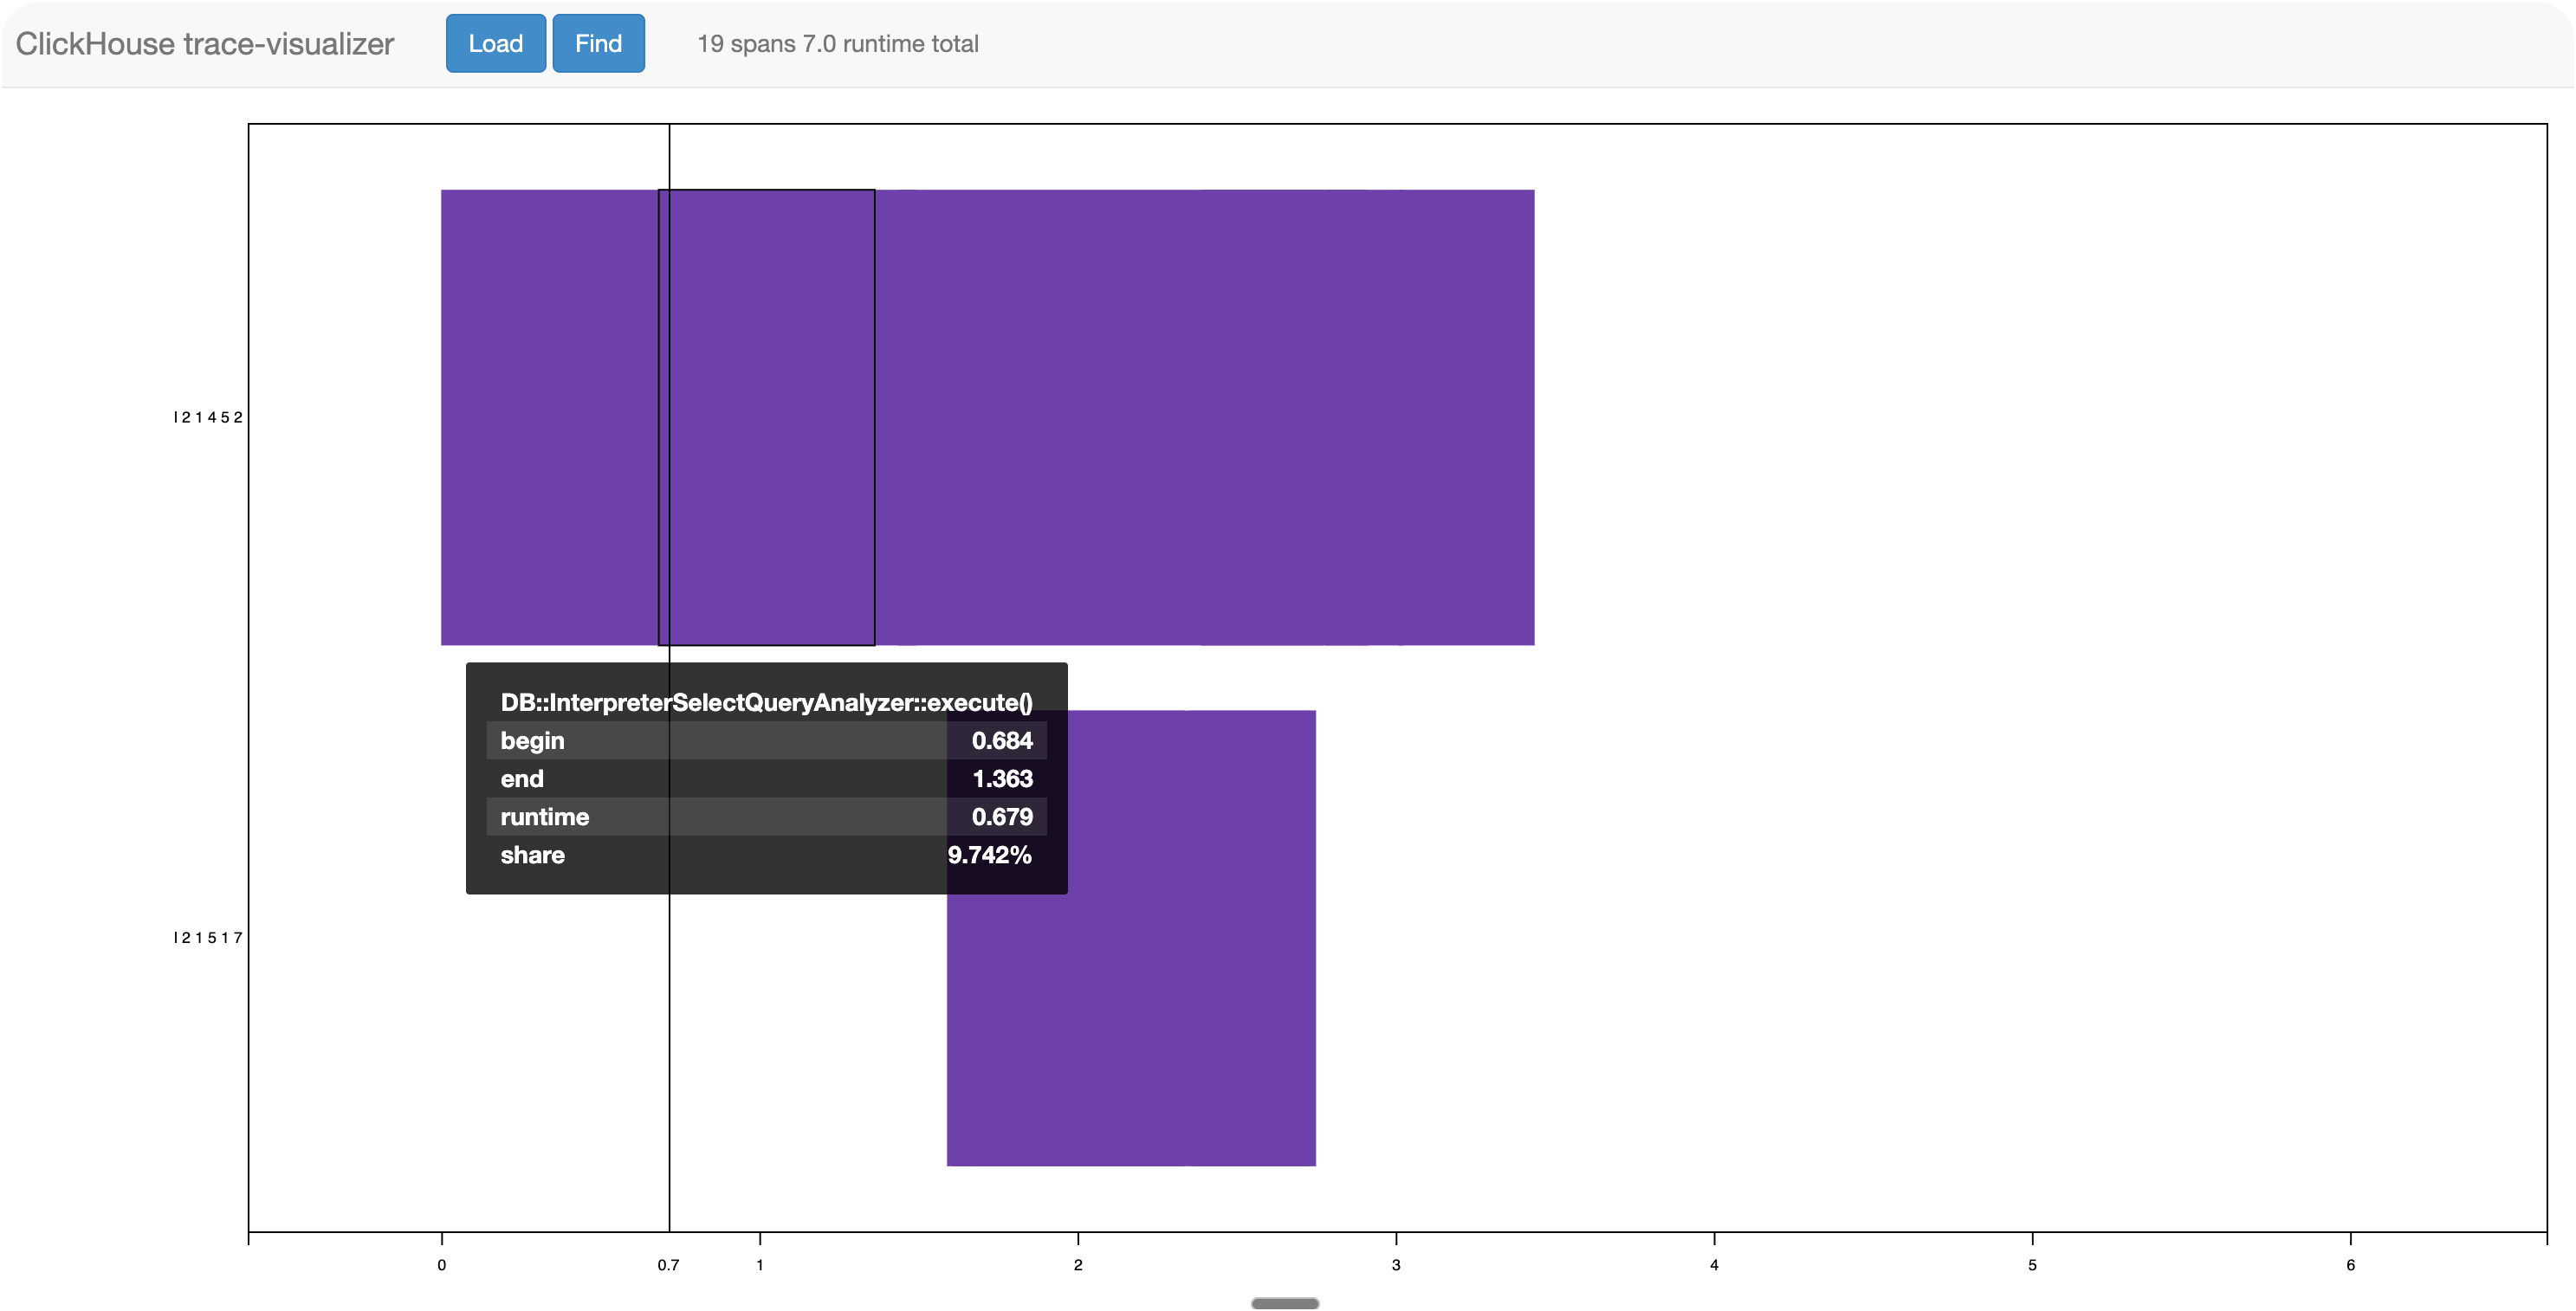
使用托管的 trace 可视化工具:https://trace-visualizer.clickhouse.com/。
加载上一步中的 trace.json 文件,以将 trace 可视化。
使用 Grafana 可视化链路追踪
我们建议使用 Grafana 和官方 ClickHouse 插件来可视化并查看链路追踪数据。 该插件已增强,支持通过 Trace Panel 可视化 traces。 这既支持作为一种可视化方式,也支持作为 Explore 中的一个组件。
按照"使用 Grafana 和 ClickHouse 实现可观测性" 中介绍的步骤,使用 ClickHouse 插件配置 Grafana。
然后,你可以在 Explore 选项卡中运行以下查询,并将 trace_id 替换为你自己的值:
SELECT
    toString(trace_id) AS traceID,
    toString(span_id) AS spanID,
    if(toString(parent_span_id)='0', '', toString(parent_span_id)) AS parentSpanID,
    'ClickHouse' AS serviceName,
    operation_name AS operationName,
    start_time_us/1000000 AS startTime,
    (finish_time_us - start_time_us)/1000 AS duration,
    arrayMap(key -> map('key', key, 'value', attribute[key]), mapKeys(attribute)) AS serviceTags
FROM system.opentelemetry_span_log
WHERE trace_id = '68a14b27-a61f-596d-3746-2b03d2530e42' ORDER BY startTime ASC
请确保将 Query type 设置为 Traces:
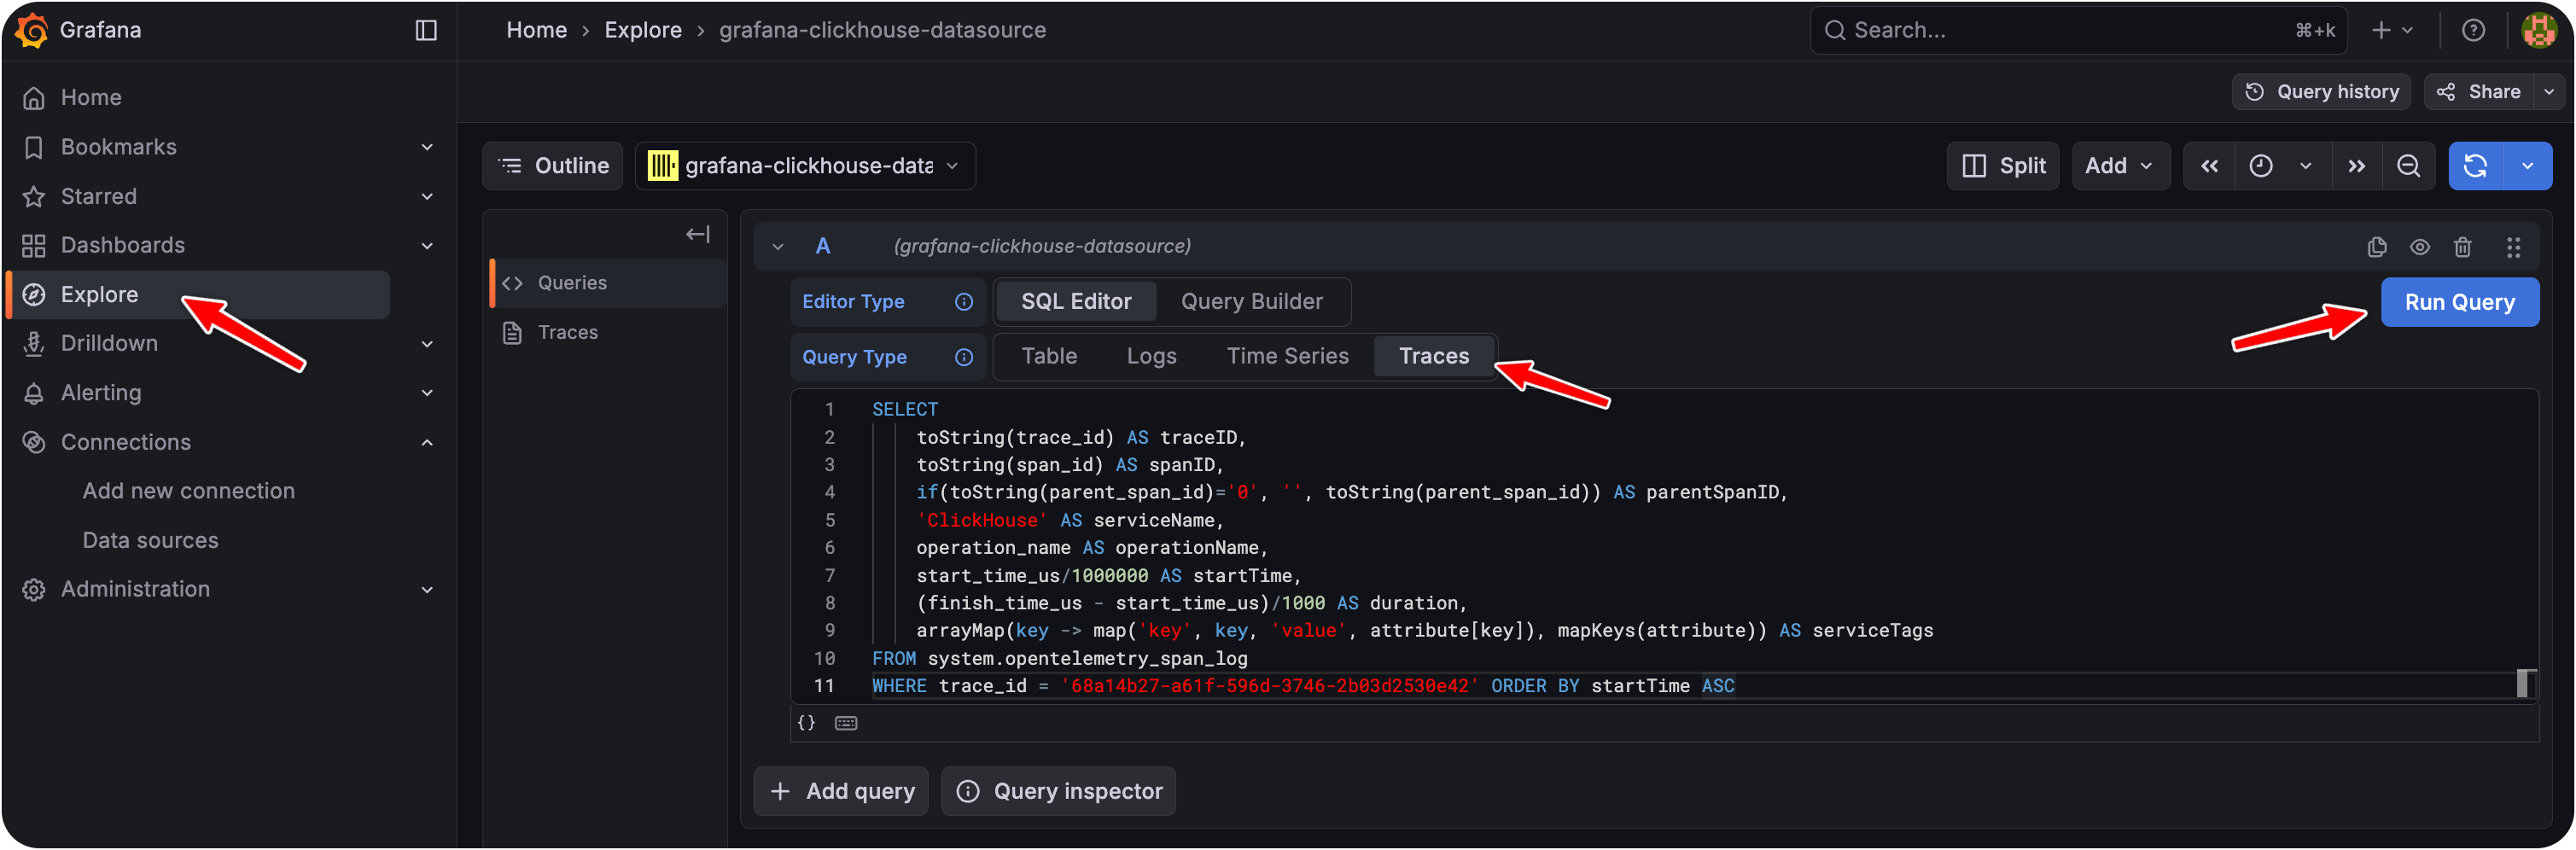
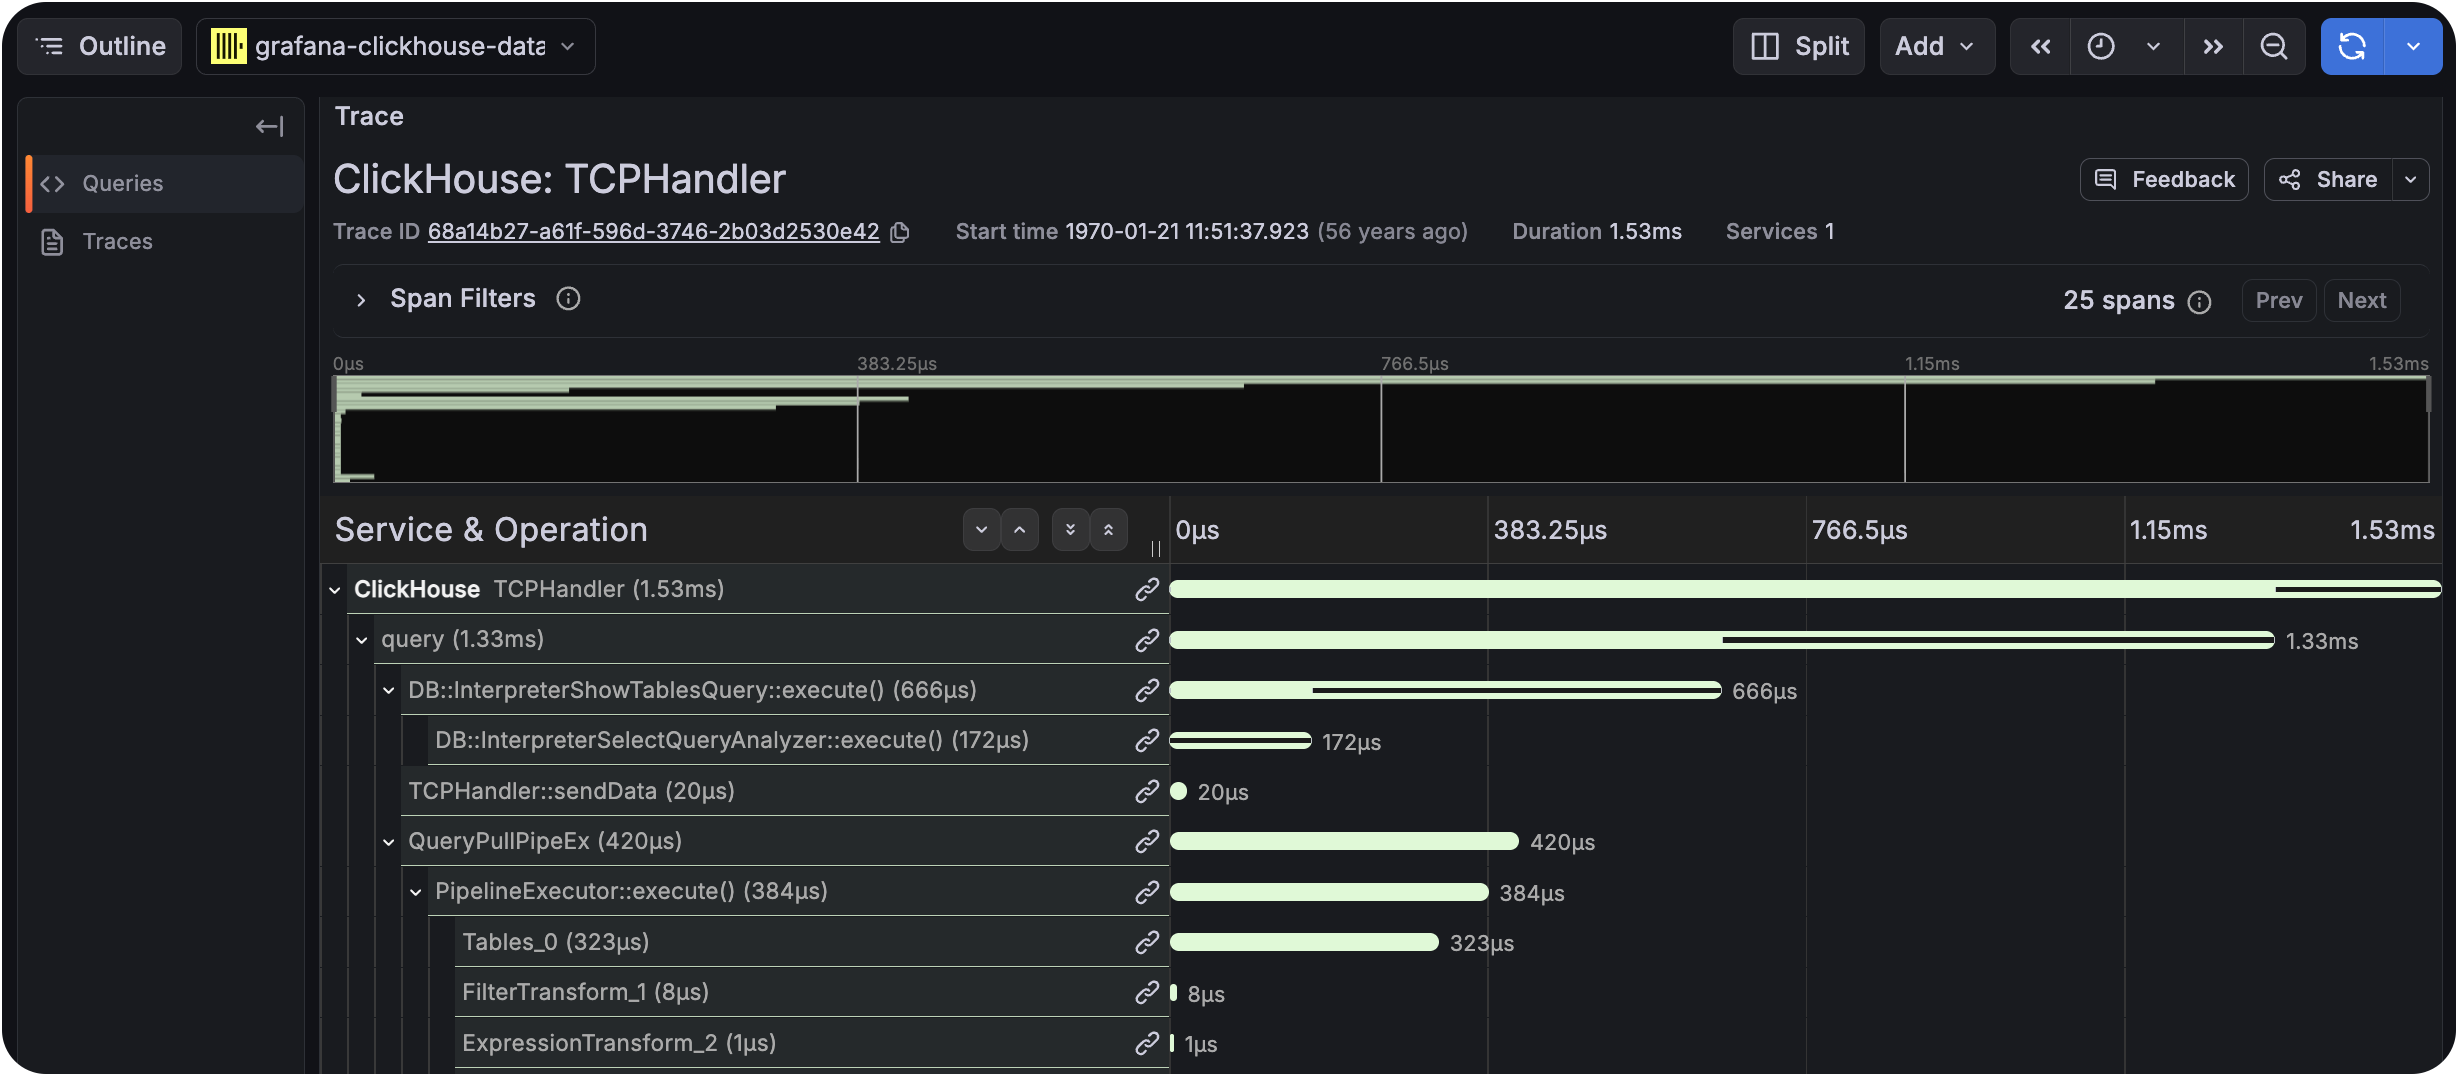
点击 "Run Query",然后查看 trace 图: