Set up docs MCP
このガイドでは、Kubernetes システムからログとメトリクスを収集し、可視化と分析のために ClickStack に送信できます。デモデータとして、必要に応じて公式 OpenTelemetry デモの ClickStack フォークを使用します。
前提条件
このガイドを進めるには、以下が必要です。
- ClickHouse 用に、少なくとも 1 つのノードで 32 GiB の RAM と 100GB のディスク容量を利用できる Kubernetes クラスター (v1.20 以降を推奨)
- Helm v3 以降
- クラスターにアクセスできるよう設定された
kubectl
デプロイオプション
このガイドは、次のいずれかのデプロイオプションで進められます。
-
Open Source ClickStack: 以下を含め、ClickStack を Kubernetes クラスター内に完全にデプロイします。
- ClickHouse
- HyperDX
- MongoDB (ダッシュボードの状態管理と設定に使用)
-
Managed ClickStack: ClickHouse と ClickStack UI (HyperDX) は ClickHouse Cloud で管理されます。これにより、クラスター内で ClickHouse や HyperDX を実行する必要がなくなります。
アプリケーショントラフィックをシミュレートするには、必要に応じて OpenTelemetry Demo Application の ClickStack フォークをデプロイできます。これにより、ログ、メトリクス、トレースを含むテレメトリーデータが生成されます。すでにクラスター内でワークロードが稼働している場合は、この手順を省略して、既存のポッド、ノード、コンテナーを監視できます。
cert-manager をインストールする (任意)
TLS 証明書が必要な場合は、Helm を使用して cert-manager をインストールします。
# Add Cert manager repo

helm repo add jetstack https://charts.jetstack.io

helm install cert-manager jetstack/cert-manager --namespace cert-manager --create-namespace --set startupapicheck.timeout=5m --set installCRDs=true --set global.leaderElection.namespace=cert-manager
OpenTelemetry Demo をデプロイする (任意)
このステップは任意で、監視対象の既存のポッドがない場合を想定しています。Kubernetes 環境にすでにサービスをデプロイしている場合はスキップできますが、このデモにはトレースとセッションリプレイのデータを生成するインストルメント済みのマイクロサービスが含まれているため、ClickStack のすべての機能を試すことができます。
以下では、オブザーバビリティのテストとインストルメンテーションの実演向けに調整された、OpenTelemetry Demo Application スタックの ClickStack フォーク版を Kubernetes クラスター内にデプロイします。これには、バックエンドのマイクロサービス、ロードジェネレーター、テレメトリー パイプライン、補助的なインフラストラクチャ (例: Kafka、Redis) 、および ClickStack との SDK インテグレーションが含まれます。
すべてのサービスは otel-demo ネームスペースにデプロイされます。各デプロイメントには次が含まれます:
- トレース、メトリクス、ログ向けの、OTel と ClickStack SDKS による自動インストルメンテーション。
- すべてのサービスは、インストルメンテーション データを
my-hyperdx-hdx-oss-v2-otel-collectorOpenTelemetry collector (未デプロイ) に送信します - 環境変数
OTEL_RESOURCE_ATTRIBUTESを介してログ、メトリクス、トレースを相関付けるための リソースタグの転送。
## download demo Kubernetes manifest file
curl -O https://raw.githubusercontent.com/ClickHouse/opentelemetry-demo/refs/heads/main/kubernetes/opentelemetry-demo.yaml
# wget alternative
# wget https://raw.githubusercontent.com/ClickHouse/opentelemetry-demo/refs/heads/main/kubernetes/opentelemetry-demo.yaml
kubectl apply --namespace otel-demo -f opentelemetry-demo.yamlデモをデプロイしたら、すべてのポッドが正常に作成され、Running 状態になっていることを確認します:
kubectl get pods -n=otel-demo

NAME                                 READY   STATUS    RESTARTS   AGE
accounting-fd44f4996-fcl4k           1/1     Running   0          13m
ad-769f968468-qq8mw                  1/1     Running   0          13m
artillery-loadgen-7bc4bdf47d-5sb96   1/1     Running   0          13m
cart-5b4c98bd8-xm7m2                 1/1     Running   0          13m
checkout-784f69b785-cnlpp            1/1     Running   0          13m
currency-fd7775b9c-rf6cr             1/1     Running   0          13m
email-5c54598f99-2td8s               1/1     Running   0          13m
flagd-5466775df7-zjb4x               2/2     Running   0          13m
fraud-detection-5769fdf75f-cjvgh     1/1     Running   0          13m
frontend-6dcb696646-fmcdz            1/1     Running   0          13m
frontend-proxy-7b8f6cd957-s25qj      1/1     Running   0          13m
image-provider-5fdb455756-fs4xv      1/1     Running   0          13m
kafka-7b6666866d-xfzn6               1/1     Running   0          13m
load-generator-57cbb7dfc9-ncxcf      1/1     Running   0          13m
payment-6d96f9bcbd-j8tj6             1/1     Running   0          13m
product-catalog-7fb77f9c78-49bhj     1/1     Running   0          13m
quote-576c557cdf-qn6pr               1/1     Running   0          13m
recommendation-546cc68fdf-8x5mm      1/1     Running   0          13m
shipping-7fc69f7fd7-zxrx6            1/1     Running   0          13m
valkey-cart-5f7b667bb7-gl5v4         1/1     Running   0          13m
デモアーキテクチャ
このデモは、異なるプログラミング言語で実装され、gRPC と HTTP 経由で相互に通信するマイクロサービス群と、Locust を使用してユーザートラフィックを擬似的に生成するロードジェネレーターで構成されています。このデモの元のソースコードは、ClickStack インストルメンテーションを使用するよう変更されています。
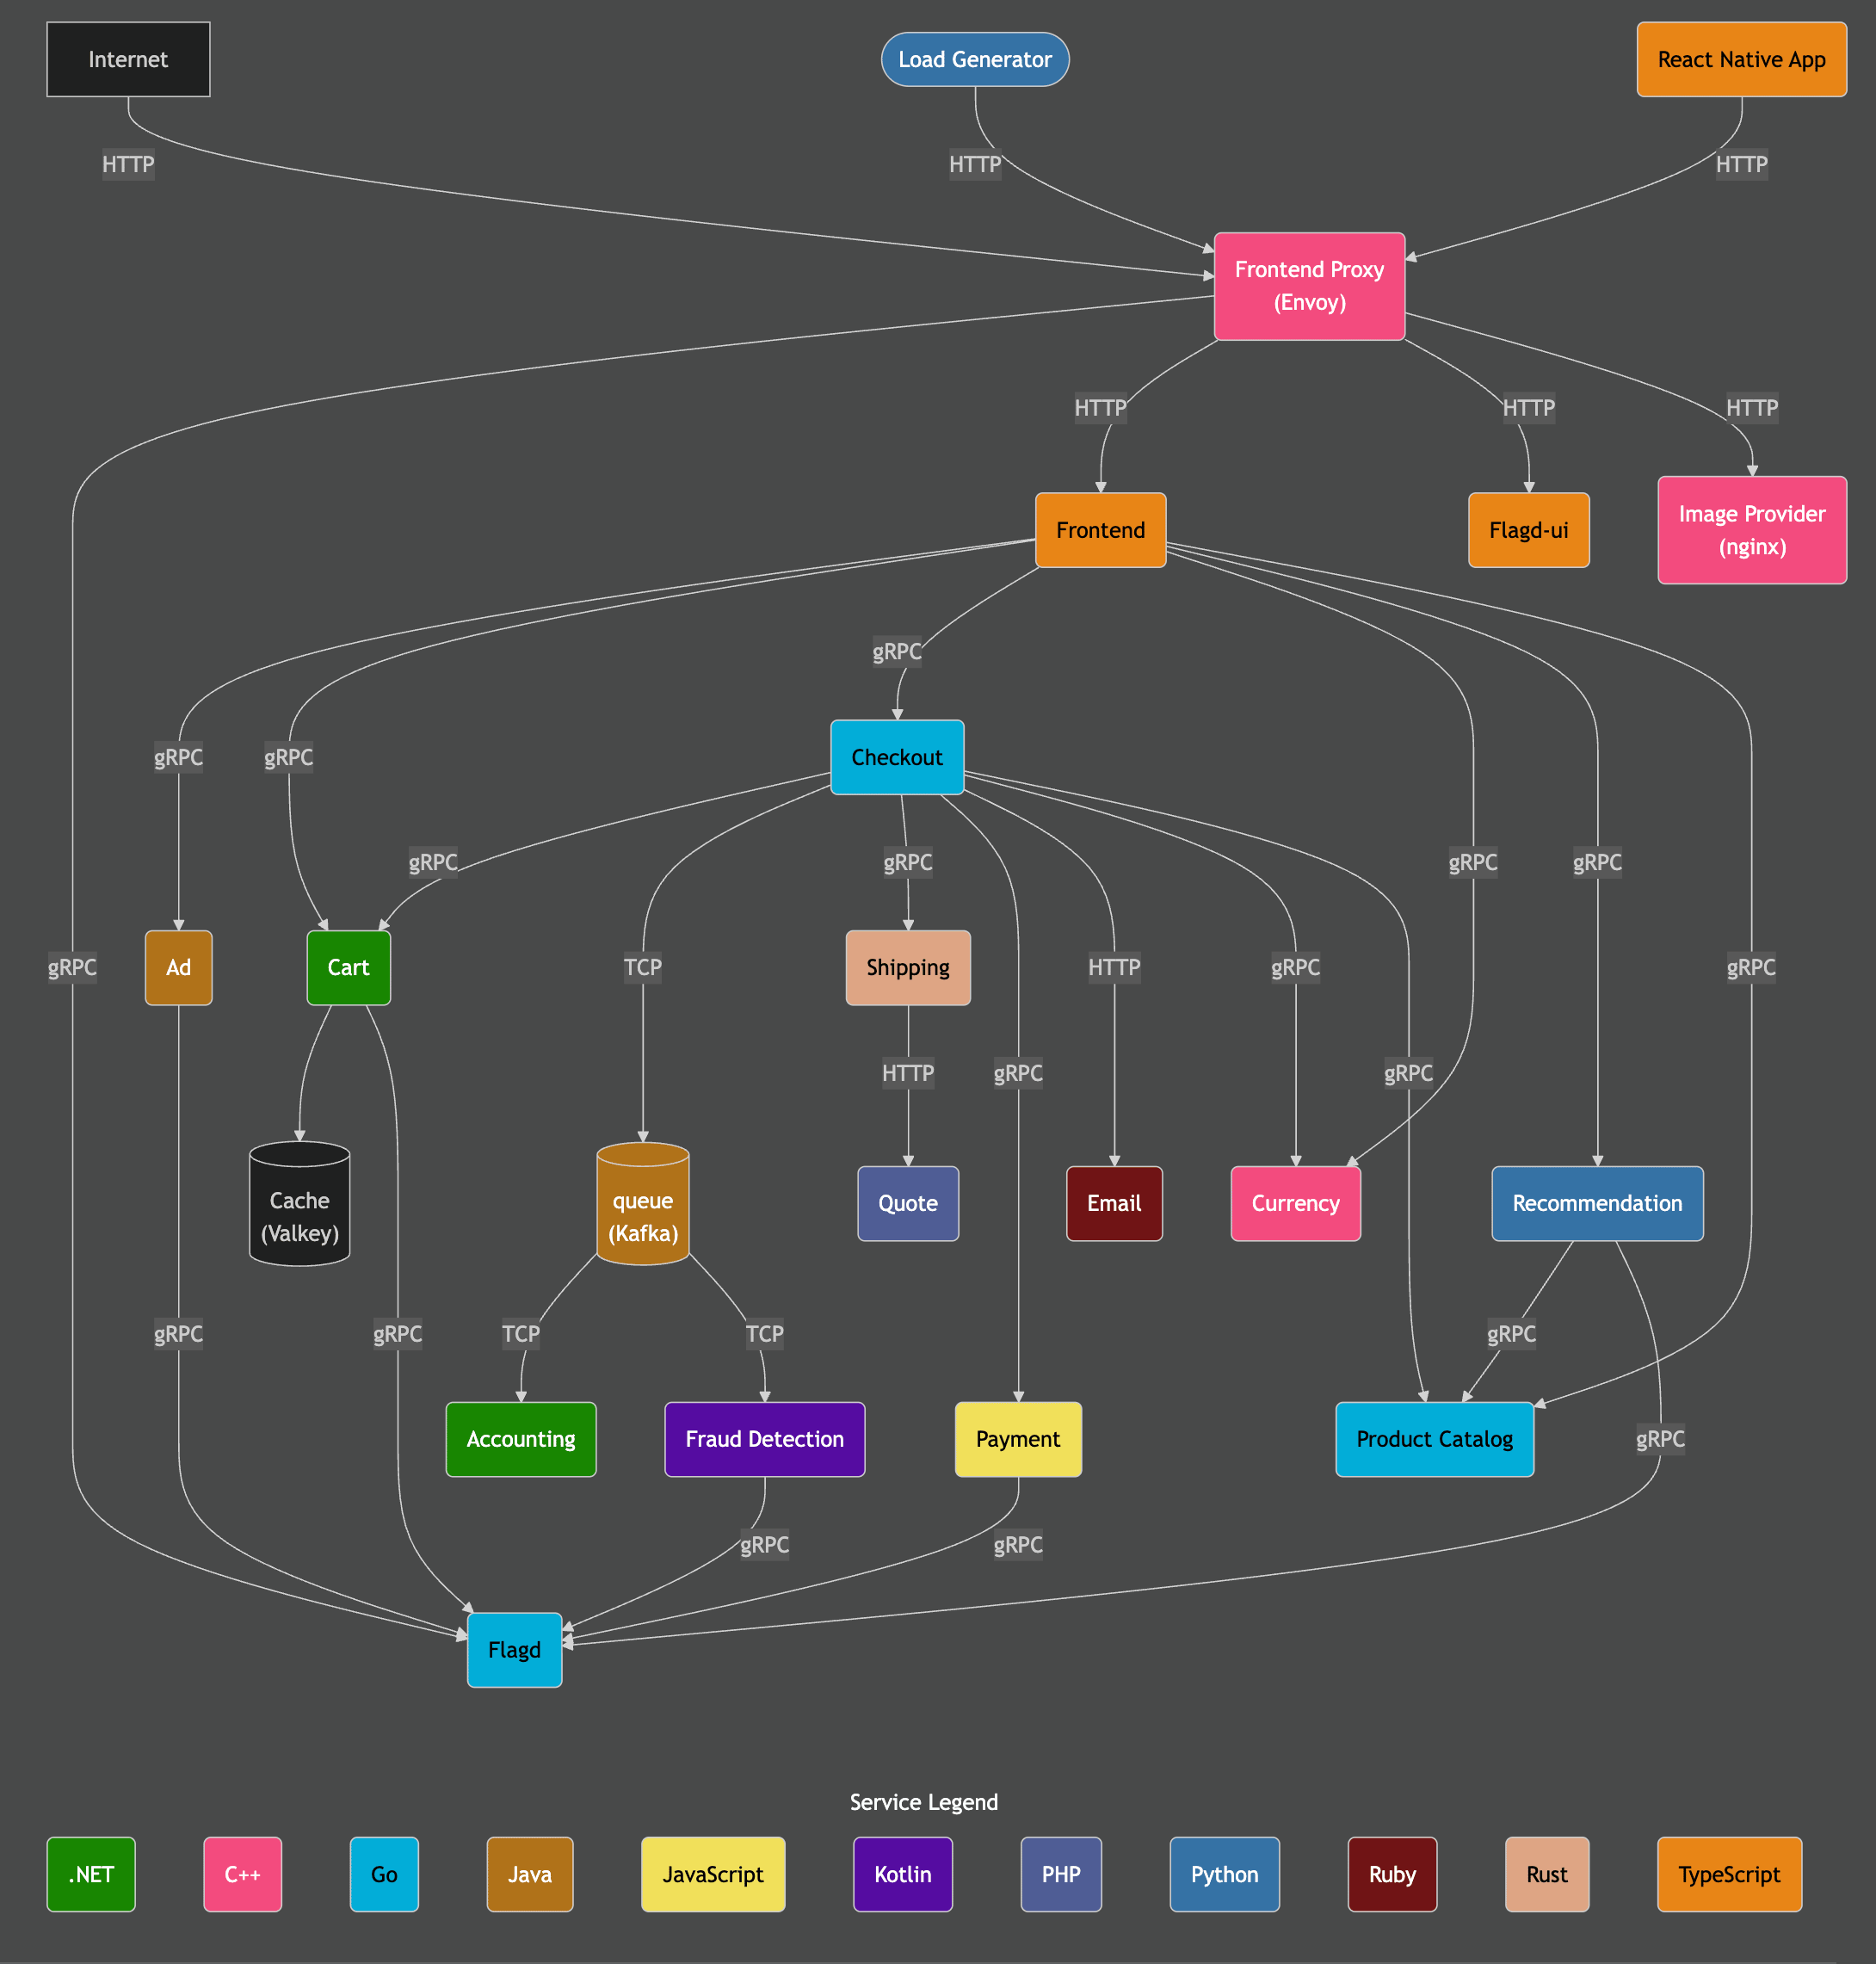
出典: https://opentelemetry.io/docs/demo/architecture/
このデモの詳細については、以下を参照してください。
ClickStack の Helm チャートリポジトリを追加する
ClickStack をデプロイするには、公式の Helm チャートを使用します。
そのため、HyperDX の Helm リポジトリを追加する必要があります。
helm repo add hyperdx https://hyperdxio.github.io/helm-charts
helm repo update
ClickStack をデプロイする
Helm チャートをインストールしたら、ClickStack をクラスターにデプロイできます。ClickHouse や HyperDX を含むすべてのコンポーネントを Kubernetes 環境内で実行することも、collector のみをデプロイして、ClickHouse と HyperDX UI には Managed ClickStack を利用することもできます。
ClickStack Open Source(セルフマネージド)
次のコマンドは、otel-demo ネームスペースに ClickStack をインストールします。この helm チャートでは、以下がデプロイされます。
- ClickHouse インスタンス
- HyperDX
- ClickStack ディストリビューションの OTel collector
- HyperDX のアプリケーション状態を保存するための MongoDB
OTel デモをデプロイしない場合は、適切なネームスペースを選んでこの設定を変更できます。
helm install my-hyperdx hyperdx/hdx-oss-v2 --set clickhouse.persistence.dataSize=100Gi --set global.storageClassName="standard-rwo" -n otel-demoManaged ClickStack
Managed ClickStack を使用する場合は、ClickStack をデプロイし、同梱の ClickHouse を無効化できます。
# ClickHouse Cloud の認証情報を指定
export CLICKHOUSE_URL=<CLICKHOUSE_CLOUD_URL> # 完全な https URL
export CLICKHOUSE_USER=<CLICKHOUSE_USER>
export CLICKHOUSE_PASSWORD=<CLICKHOUSE_PASSWORD>

helm install my-hyperdx hyperdx/hdx-oss-v2  --set clickhouse.enabled=false --set clickhouse.persistence.enabled=false --set otel.clickhouseEndpoint=${CLICKHOUSE_URL} --set clickhouse.config.users.otelUserName=${CLICKHOUSE_USER} --set clickhouse.config.users.otelUserPassword=${CLICKHOUSE_PASSWORD} --set global.storageClassName="standard-rwo" -n otel-demo
デプロイメントのステータスを確認するには、次のコマンドを実行し、すべてのコンポーネントが Running 状態になっていることを確認してください。Managed ClickStack を使用している場合、ClickHouse は表示されません。
kubectl get pods -l "app.kubernetes.io/name=hdx-oss-v2" -n otel-demo

NAME                                                    READY   STATUS    RESTARTS   AGE
my-hyperdx-hdx-oss-v2-app-78876d79bb-565tb              1/1     Running   0          14m
my-hyperdx-hdx-oss-v2-clickhouse-57975fcd6-ggnz2        1/1     Running   0          14m
my-hyperdx-hdx-oss-v2-mongodb-984845f96-czb6m           1/1     Running   0          14m
my-hyperdx-hdx-oss-v2-otel-collector-64cf698f5c-8s7qj   1/1     Running   0          14m
HyperDX UI にアクセスする
セキュリティ上の理由から、このサービスは ClusterIP を使用しており、デフォルトでは外部に公開されません。
HyperDX UI にアクセスするには、3000 からローカルポート 8080 へポートフォワードします。
kubectl port-forward \
 pod/$(kubectl get pod -l app.kubernetes.io/name=hdx-oss-v2 -o jsonpath='{.items[0].metadata.name}' -n otel-demo) \
  8080:3000 \
 -n otel-demo
HyperDX UI にアクセスするには、http://localhost:8080 にアクセスします。
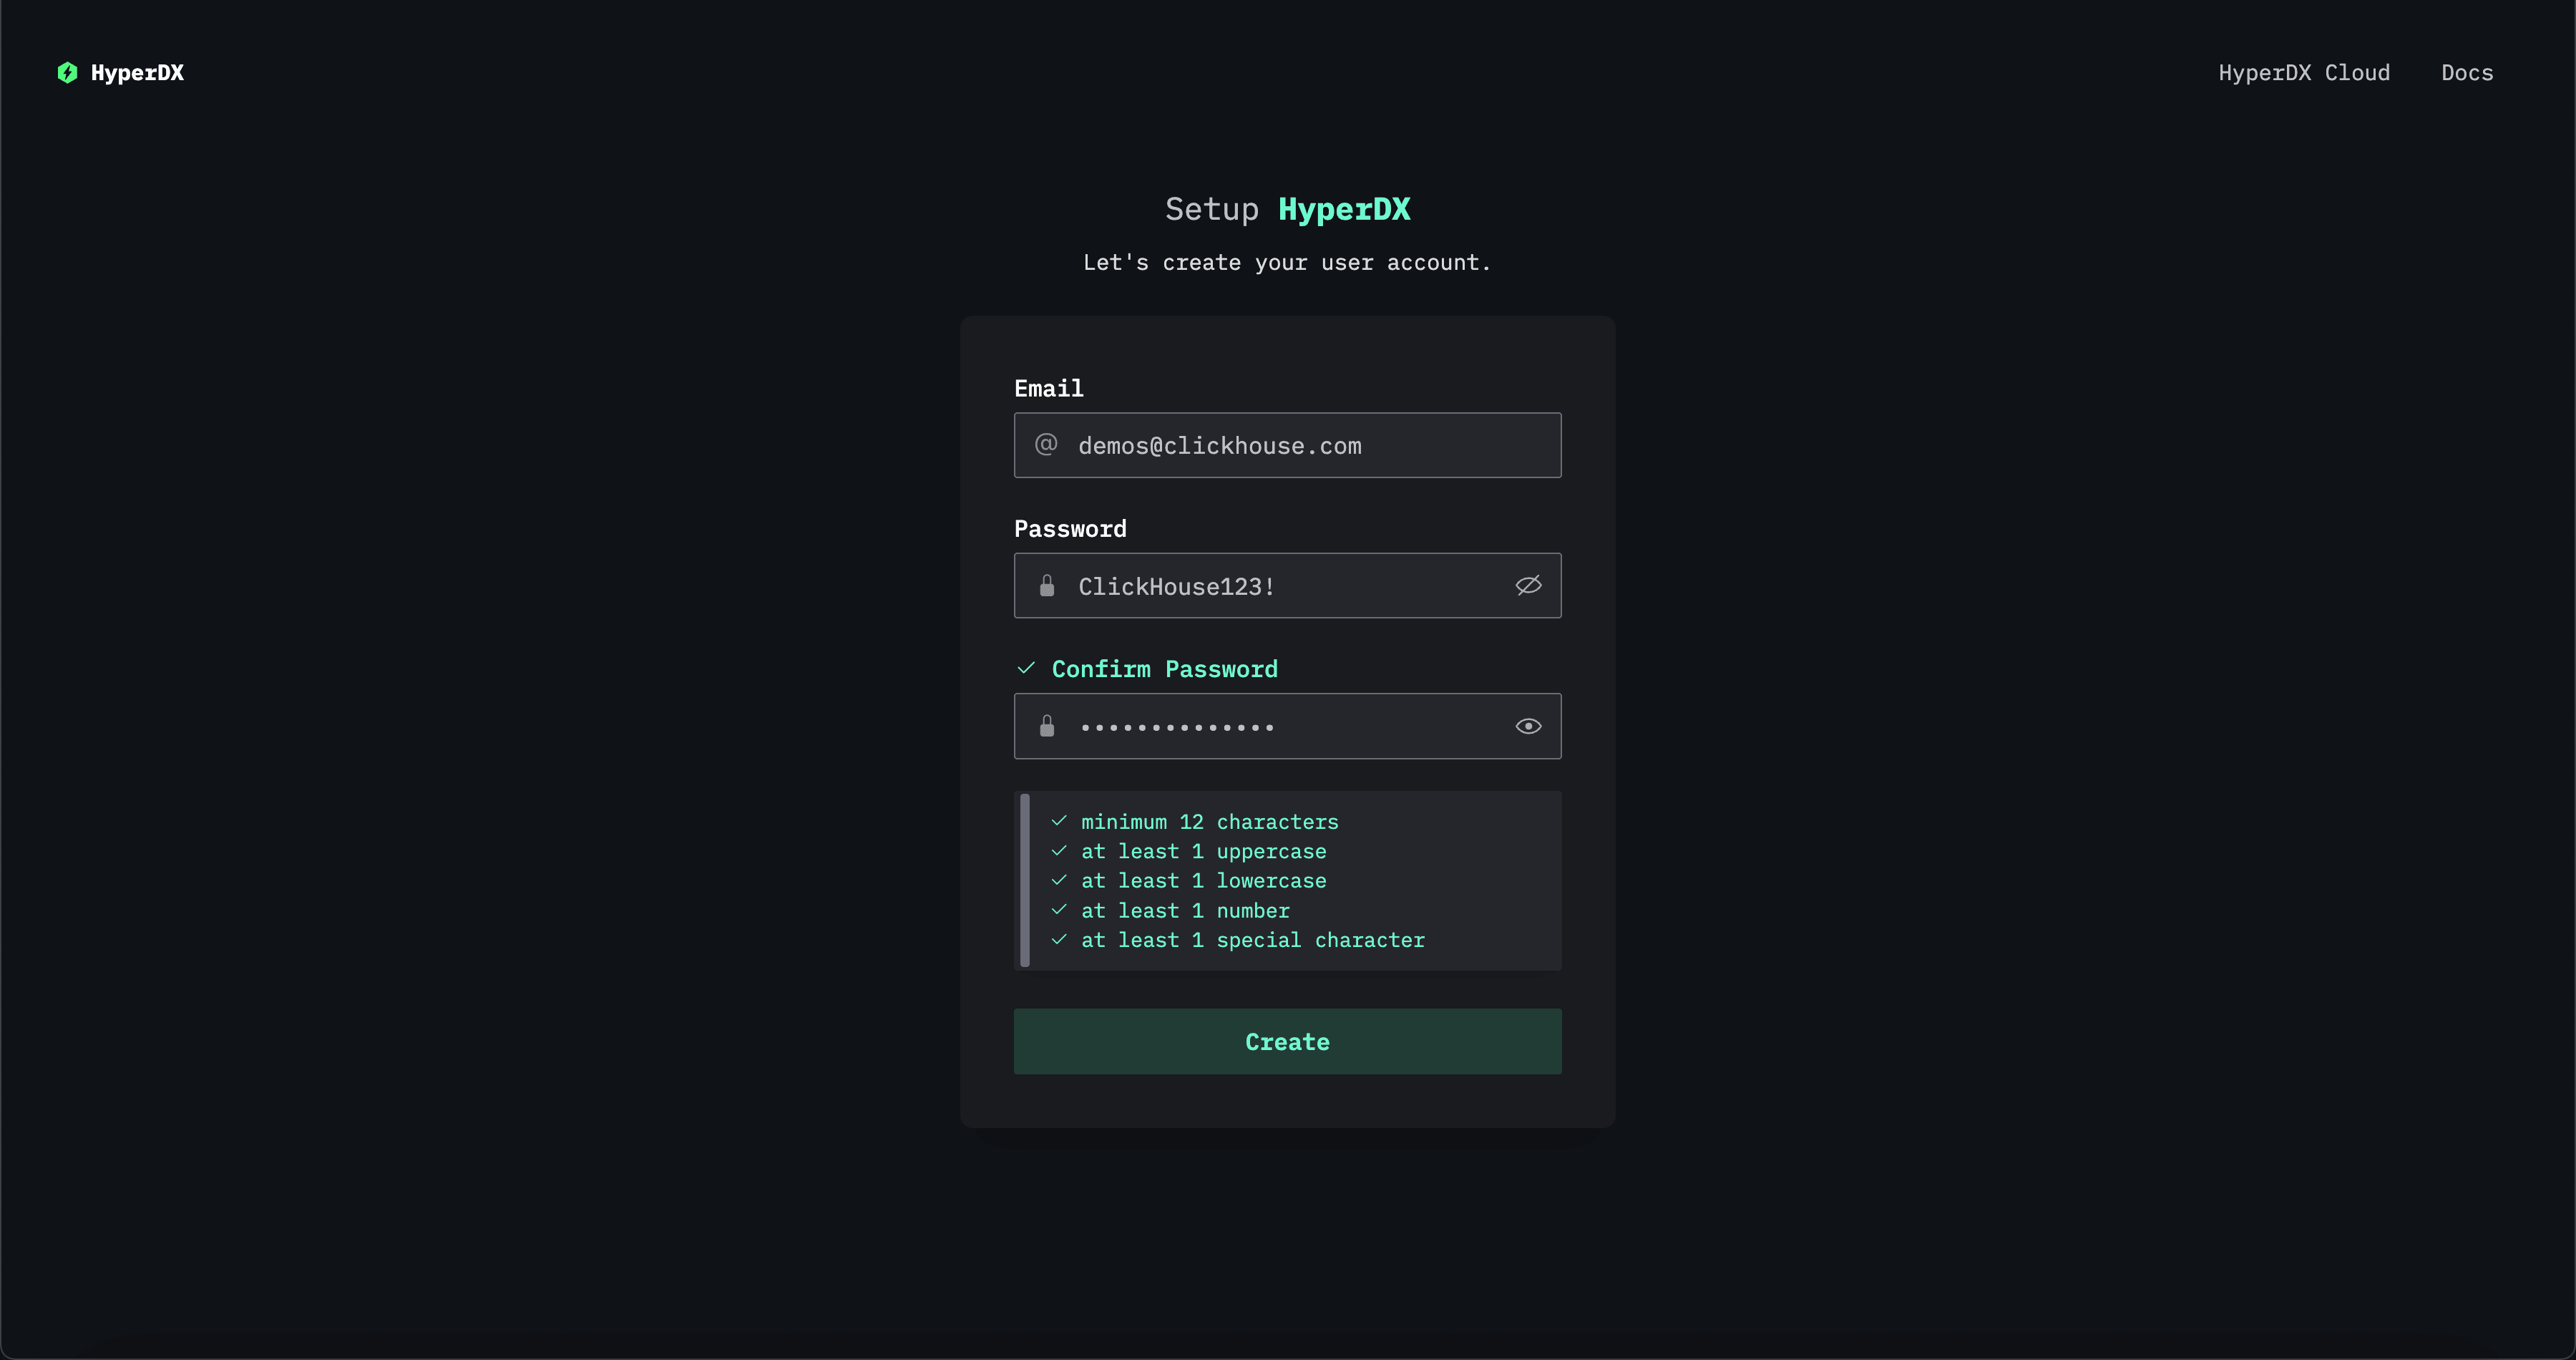
複雑さの要件を満たすユーザー名とパスワードを指定して、ユーザーを作成します。
インジェスト API key を取得する
ClickStack collector によってデプロイされた OTel collector へのインジェストは、インジェストキーで保護されています。
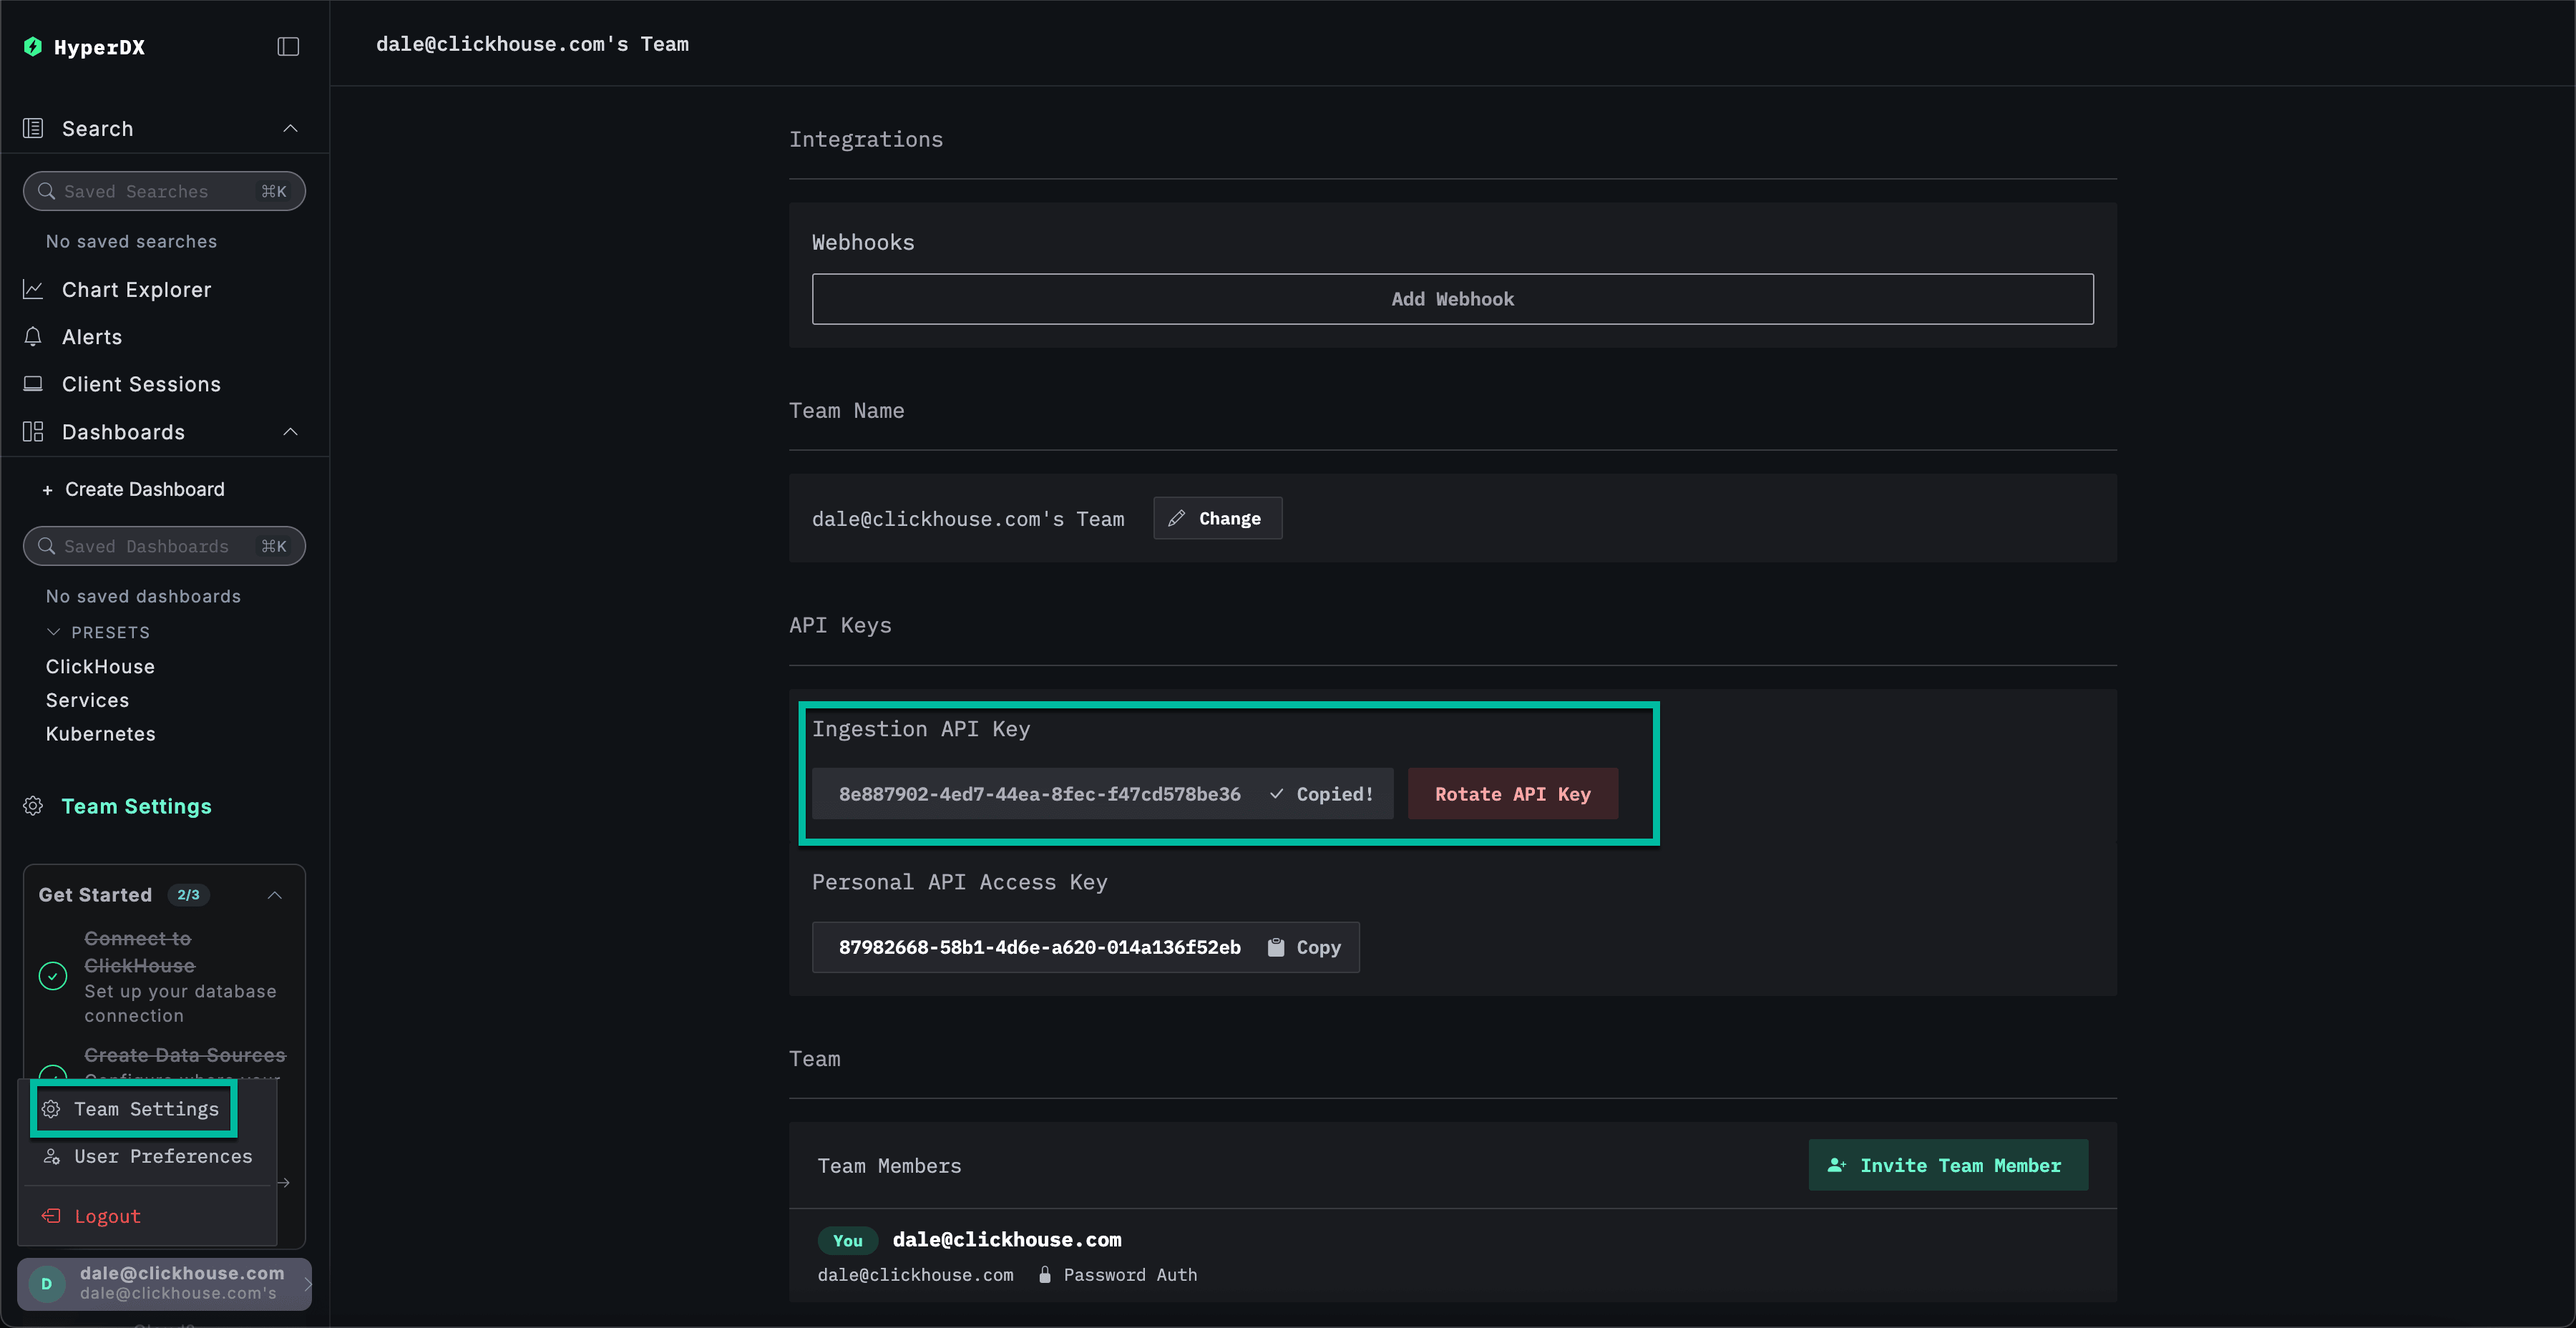
Team Settings に移動し、API Keys セクションから Ingestion API Key をコピーします。この API key により、OpenTelemetry collector 経由のデータインジェストの安全性が確保されます。
API key 用の Kubernetes Secret を作成する
インジェスト API key と、ClickStack Helm チャートでデプロイした OTel collector の場所を格納した ConfigMap を含む、新しい Kubernetes Secret を作成します。後続のコンポーネントはこれを使用して、ClickStack Helm チャートでデプロイした collector へのインジェストを行えるようになります。
# create secret with the ingestion API key
kubectl create secret generic hyperdx-secret \
--from-literal=HYPERDX_API_KEY=<ingestion_api_key> \
-n otel-demo

# create a ConfigMap pointing to the ClickStack OTel collector deployed above
kubectl create configmap -n=otel-demo otel-config-vars --from-literal=YOUR_OTEL_COLLECTOR_ENDPOINT=http://my-hyperdx-hdx-oss-v2-otel-collector:4318
インジェスト API keyを反映するため、OpenTelemetry Demo Applicationのポッドを再起動します。
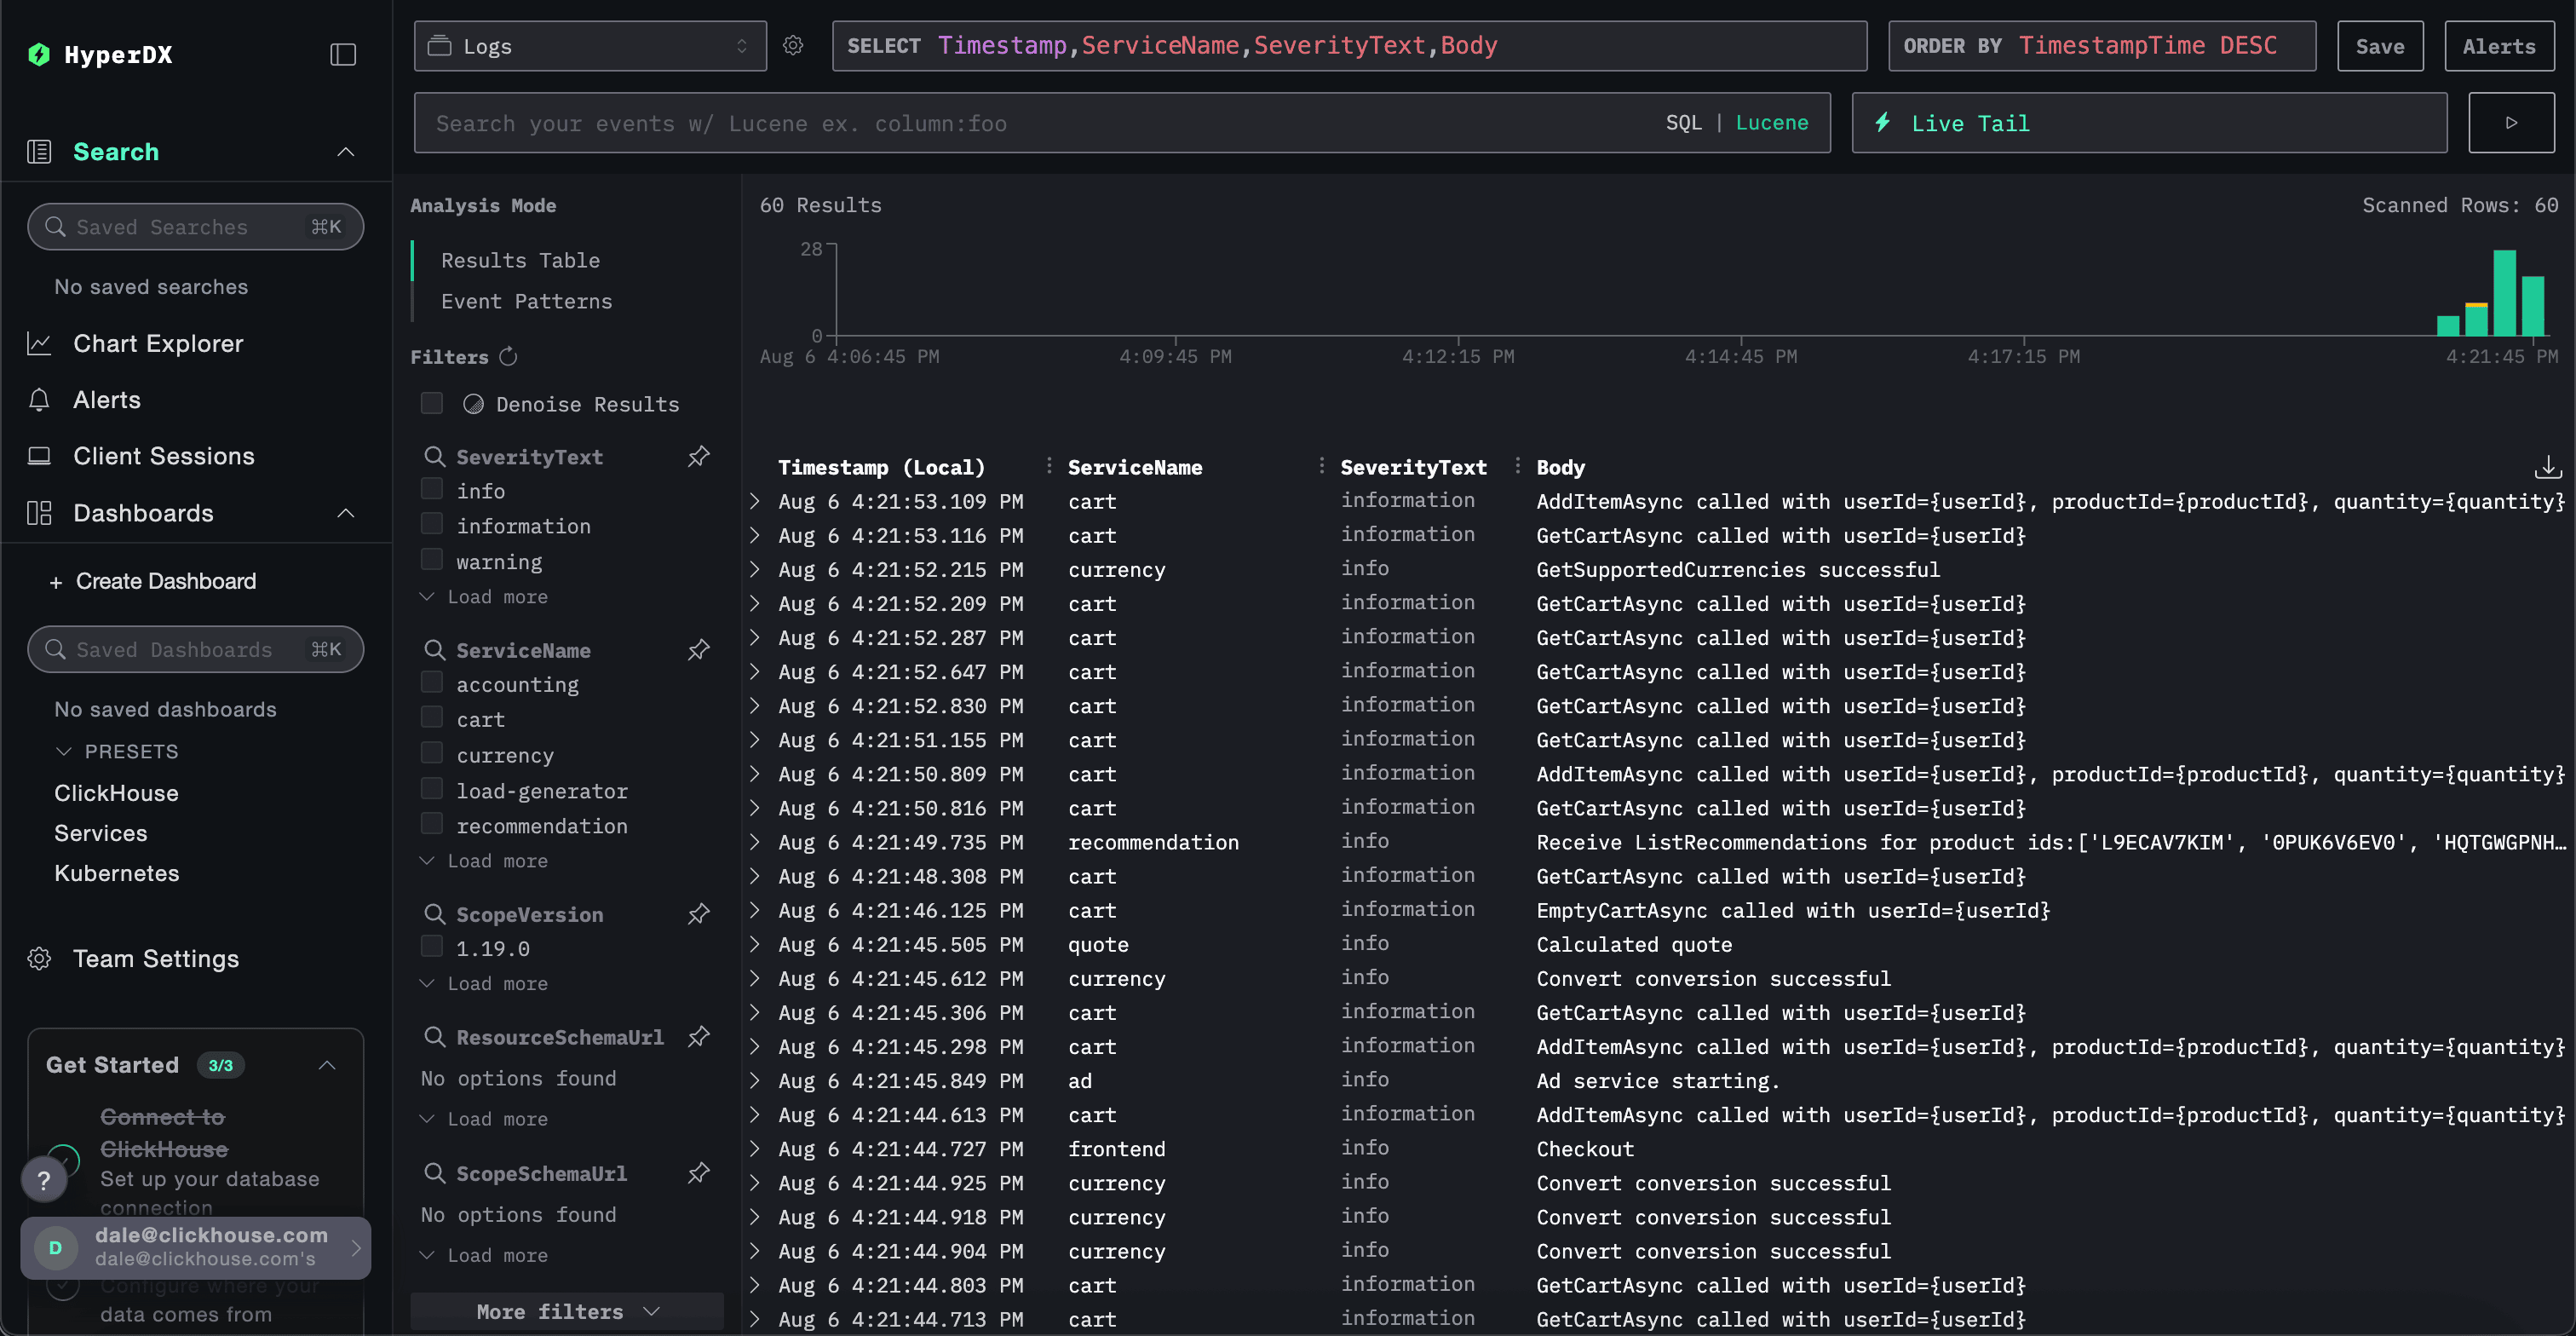
kubectl rollout restart deployment -n otel-demo -l app.kubernetes.io/part-of=opentelemetry-demoデモサービスからのトレースおよびログデータが、HyperDX に流れ始めるはずです。
OpenTelemetry Helm リポジトリを追加する
Kubernetes のメトリクスを収集するため、標準の OTel collector をデプロイし、上記のインジェスト API key を使ってデータを ClickStack collector に安全に送信するよう設定します。
これには、OpenTelemetry Helm リポジトリをインストールする必要があります。
# Add Otel Helm repo
helm repo add open-telemetry https://open-telemetry.github.io/opentelemetry-helm-charts
Kubernetes collector コンポーネントのデプロイ
クラスター自体と各ノードの両方からログとメトリクスを収集するには、それぞれ独自のマニフェストを持つ2つの独立したOpenTelemetry Collectorをデプロイする必要があります。提供されている2つのマニフェスト (k8s_deployment.yaml と k8s_daemonset.yaml) は連携して機能し、Kubernetesクラスターから包括的なテレメトリーデータを収集します。
-
k8s_deployment.yamlは、クラスター全体のイベントとメタデータを収集する役割を持つ単一の OpenTelemetry Collector インスタンスをデプロイします。Kubernetes イベントとクラスターのメトリクスを収集し、ポッドのラベルやアノテーションを使ってテレメトリーデータを拡充します。データの重複を避けるため、この collector は 1 つのレプリカを持つスタンドアロンのデプロイメントとして実行されます。 -
k8s_daemonset.yamlは、クラスター内のすべてのノードで実行される デーモンセットベースの collector をデプロイします。これは、kubeletstats、hostmetrics、Kubernetes Attribute Processor などのコンポーネントを使用して、ノードレベルおよびポッドレベルのメトリクス に加え、コンテナーログも収集します。これらの collector はログにメタデータを付与し、OTLP エクスポーターを使用して HyperDX に送信します。
これらのマニフェストを組み合わせることで、インフラストラクチャからアプリケーションレベルのテレメトリーまで、クラスター全体にわたるフルスタックのオブザーバビリティが実現し、エンリッチされたデータを一元分析のためにClickStackへ送信します。
まず、collector をデプロイメントとしてインストールします。
# download manifest file
curl -O https://raw.githubusercontent.com/ClickHouse/clickhouse-docs/refs/heads/main/docs/use-cases/observability/clickstack/example-datasets/_snippets/k8s_deployment.yaml
# install the helm chart
helm install --namespace otel-demo k8s-otel-deployment open-telemetry/opentelemetry-collector -f k8s_deployment.yaml
k8s_deployment.yaml
# k8s_deployment.yaml
mode: deployment

image:
  repository: otel/opentelemetry-collector-contrib
  tag: 0.123.0

# We only want one of these collectors - any more and we'd produce duplicate data
replicaCount: 1

presets:
  kubernetesAttributes:
    enabled: true
    # When enabled, the processor will extract all labels for an associated pod and add them as resource attributes.
    # The label's exact name will be the key.
    extractAllPodLabels: true
    # When enabled, the processor will extract all annotations for an associated pod and add them as resource attributes.
    # The annotation's exact name will be the key.
    extractAllPodAnnotations: true
  # Configures the collector to collect Kubernetes events.
  # Adds the k8sobject receiver to the logs pipeline and collects Kubernetes events by default.
  # More Info: https://opentelemetry.io/docs/kubernetes/collector/components/#kubernetes-objects-receiver
  kubernetesEvents:
    enabled: true
  # Configures the Kubernetes Cluster Receiver to collect cluster-level metrics.
  # Adds the k8s_cluster receiver to the metrics pipeline and adds the necessary rules to ClusteRole.
  # More Info: https://opentelemetry.io/docs/kubernetes/collector/components/#kubernetes-cluster-receiver
  clusterMetrics:
    enabled: true

extraEnvs:
  - name: HYPERDX_API_KEY
    valueFrom:
      secretKeyRef:
        name: hyperdx-secret
        key: HYPERDX_API_KEY
        optional: true
  - name: YOUR_OTEL_COLLECTOR_ENDPOINT
    valueFrom:
      configMapKeyRef:
        name: otel-config-vars
        key: YOUR_OTEL_COLLECTOR_ENDPOINT

config:
  exporters:
    otlphttp:
      endpoint: "${env:YOUR_OTEL_COLLECTOR_ENDPOINT}"
      compression: gzip
      headers:
        authorization: "${env:HYPERDX_API_KEY}"
  service:
    pipelines:
      logs:
        exporters:
          - otlphttp
      metrics:
        exporters:
          - otlphttp
次に、ノードおよびポッドレベルのメトリクスとログを収集するため、collectorをデーモンセットとしてデプロイします。
# download manifest file
curl -O https://raw.githubusercontent.com/ClickHouse/clickhouse-docs/refs/heads/main/docs/use-cases/observability/clickstack/example-datasets/_snippets/k8s_daemonset.yaml
# install the helm chart
helm install --namespace otel-demo k8s-otel-daemonset open-telemetry/opentelemetry-collector -f k8s_daemonset.yaml
k8s_daemonset.yaml
# k8s_daemonset.yaml
mode: daemonset

image:
  repository: otel/opentelemetry-collector-contrib
  tag: 0.123.0

# Required to use the kubeletstats cpu/memory utilization metrics
clusterRole:
  create: true
  rules:
    - apiGroups:
        - ''
      resources:
        - nodes/proxy
      verbs:
        - get

presets:
  logsCollection:
    enabled: true
  hostMetrics:
    enabled: true
  # Configures the Kubernetes Processor to add Kubernetes metadata.
  # Adds the k8sattributes processor to all the pipelines and adds the necessary rules to ClusterRole.
  # More Info: https://opentelemetry.io/docs/kubernetes/collector/components/#kubernetes-attributes-processor
  kubernetesAttributes:
    enabled: true
    # When enabled, the processor will extract all labels for an associated pod and add them as resource attributes.
    # The label's exact name will be the key.
    extractAllPodLabels: true
    # When enabled, the processor will extract all annotations for an associated pod and add them as resource attributes.
    # The annotation's exact name will be the key.
    extractAllPodAnnotations: true
  # Configures the collector to collect node, pod, and container metrics from the API server on a kubelet..
  # Adds the kubeletstats receiver to the metrics pipeline and adds the necessary rules to ClusterRole.
  # More Info: https://opentelemetry.io/docs/kubernetes/collector/components/#kubeletstats-receiver
  kubeletMetrics:
    enabled: true

extraEnvs:
  - name: HYPERDX_API_KEY
    valueFrom:
      secretKeyRef:
        name: hyperdx-secret
        key: HYPERDX_API_KEY
        optional: true
  - name: YOUR_OTEL_COLLECTOR_ENDPOINT
    valueFrom:
      configMapKeyRef:
        name: otel-config-vars
        key: YOUR_OTEL_COLLECTOR_ENDPOINT

config:
  receivers:
    # Configures additional kubelet metrics
    kubeletstats:
      collection_interval: 20s
      auth_type: 'serviceAccount'
      endpoint: '${env:K8S_NODE_NAME}:10250'
      insecure_skip_verify: true
      metrics:
        k8s.pod.cpu_limit_utilization:
          enabled: true
        k8s.pod.cpu_request_utilization:
          enabled: true
        k8s.pod.memory_limit_utilization:
          enabled: true
        k8s.pod.memory_request_utilization:
          enabled: true
        k8s.pod.uptime:
          enabled: true
        k8s.node.uptime:
          enabled: true
        k8s.container.cpu_limit_utilization:
          enabled: true
        k8s.container.cpu_request_utilization:
          enabled: true
        k8s.container.memory_limit_utilization:
          enabled: true
        k8s.container.memory_request_utilization:
          enabled: true
        container.uptime:
          enabled: true

  exporters:
    otlphttp:
      endpoint: "${env:YOUR_OTEL_COLLECTOR_ENDPOINT}"
      compression: gzip
      headers:
        authorization: "${env:HYPERDX_API_KEY}"

  service:
    pipelines:
      logs:
        exporters:
          - otlphttp
      metrics:
        exporters:
          - otlphttp
HyperDX で Kubernetes データを確認する
Kubernetes にデプロイしたインスタンスを使う場合も、Managed ClickStack を使う場合も、HyperDX UI にアクセスします。
Managed ClickStack
Managed ClickStack を使用している場合は、ClickHouse Cloud サービスにログインし、左側のメニューから "ClickStack" を選択するだけです。自動的に認証されるため、ユーザーを作成する必要はありません。
ログ、メトリクス、トレース用のデータソースはあらかじめ作成されています。
ClickStack Open Source
ローカルにデプロイした HyperDX にアクセスするには、次のローカルコマンドでポートフォワードを実行し、http://localhost:8080 で HyperDX にアクセスします。
kubectl port-forward \
 pod/$(kubectl get pod -l app.kubernetes.io/name=hdx-oss-v2 -o jsonpath='{.items[0].metadata.name}' -n otel-demo) \
  8080:3000 \
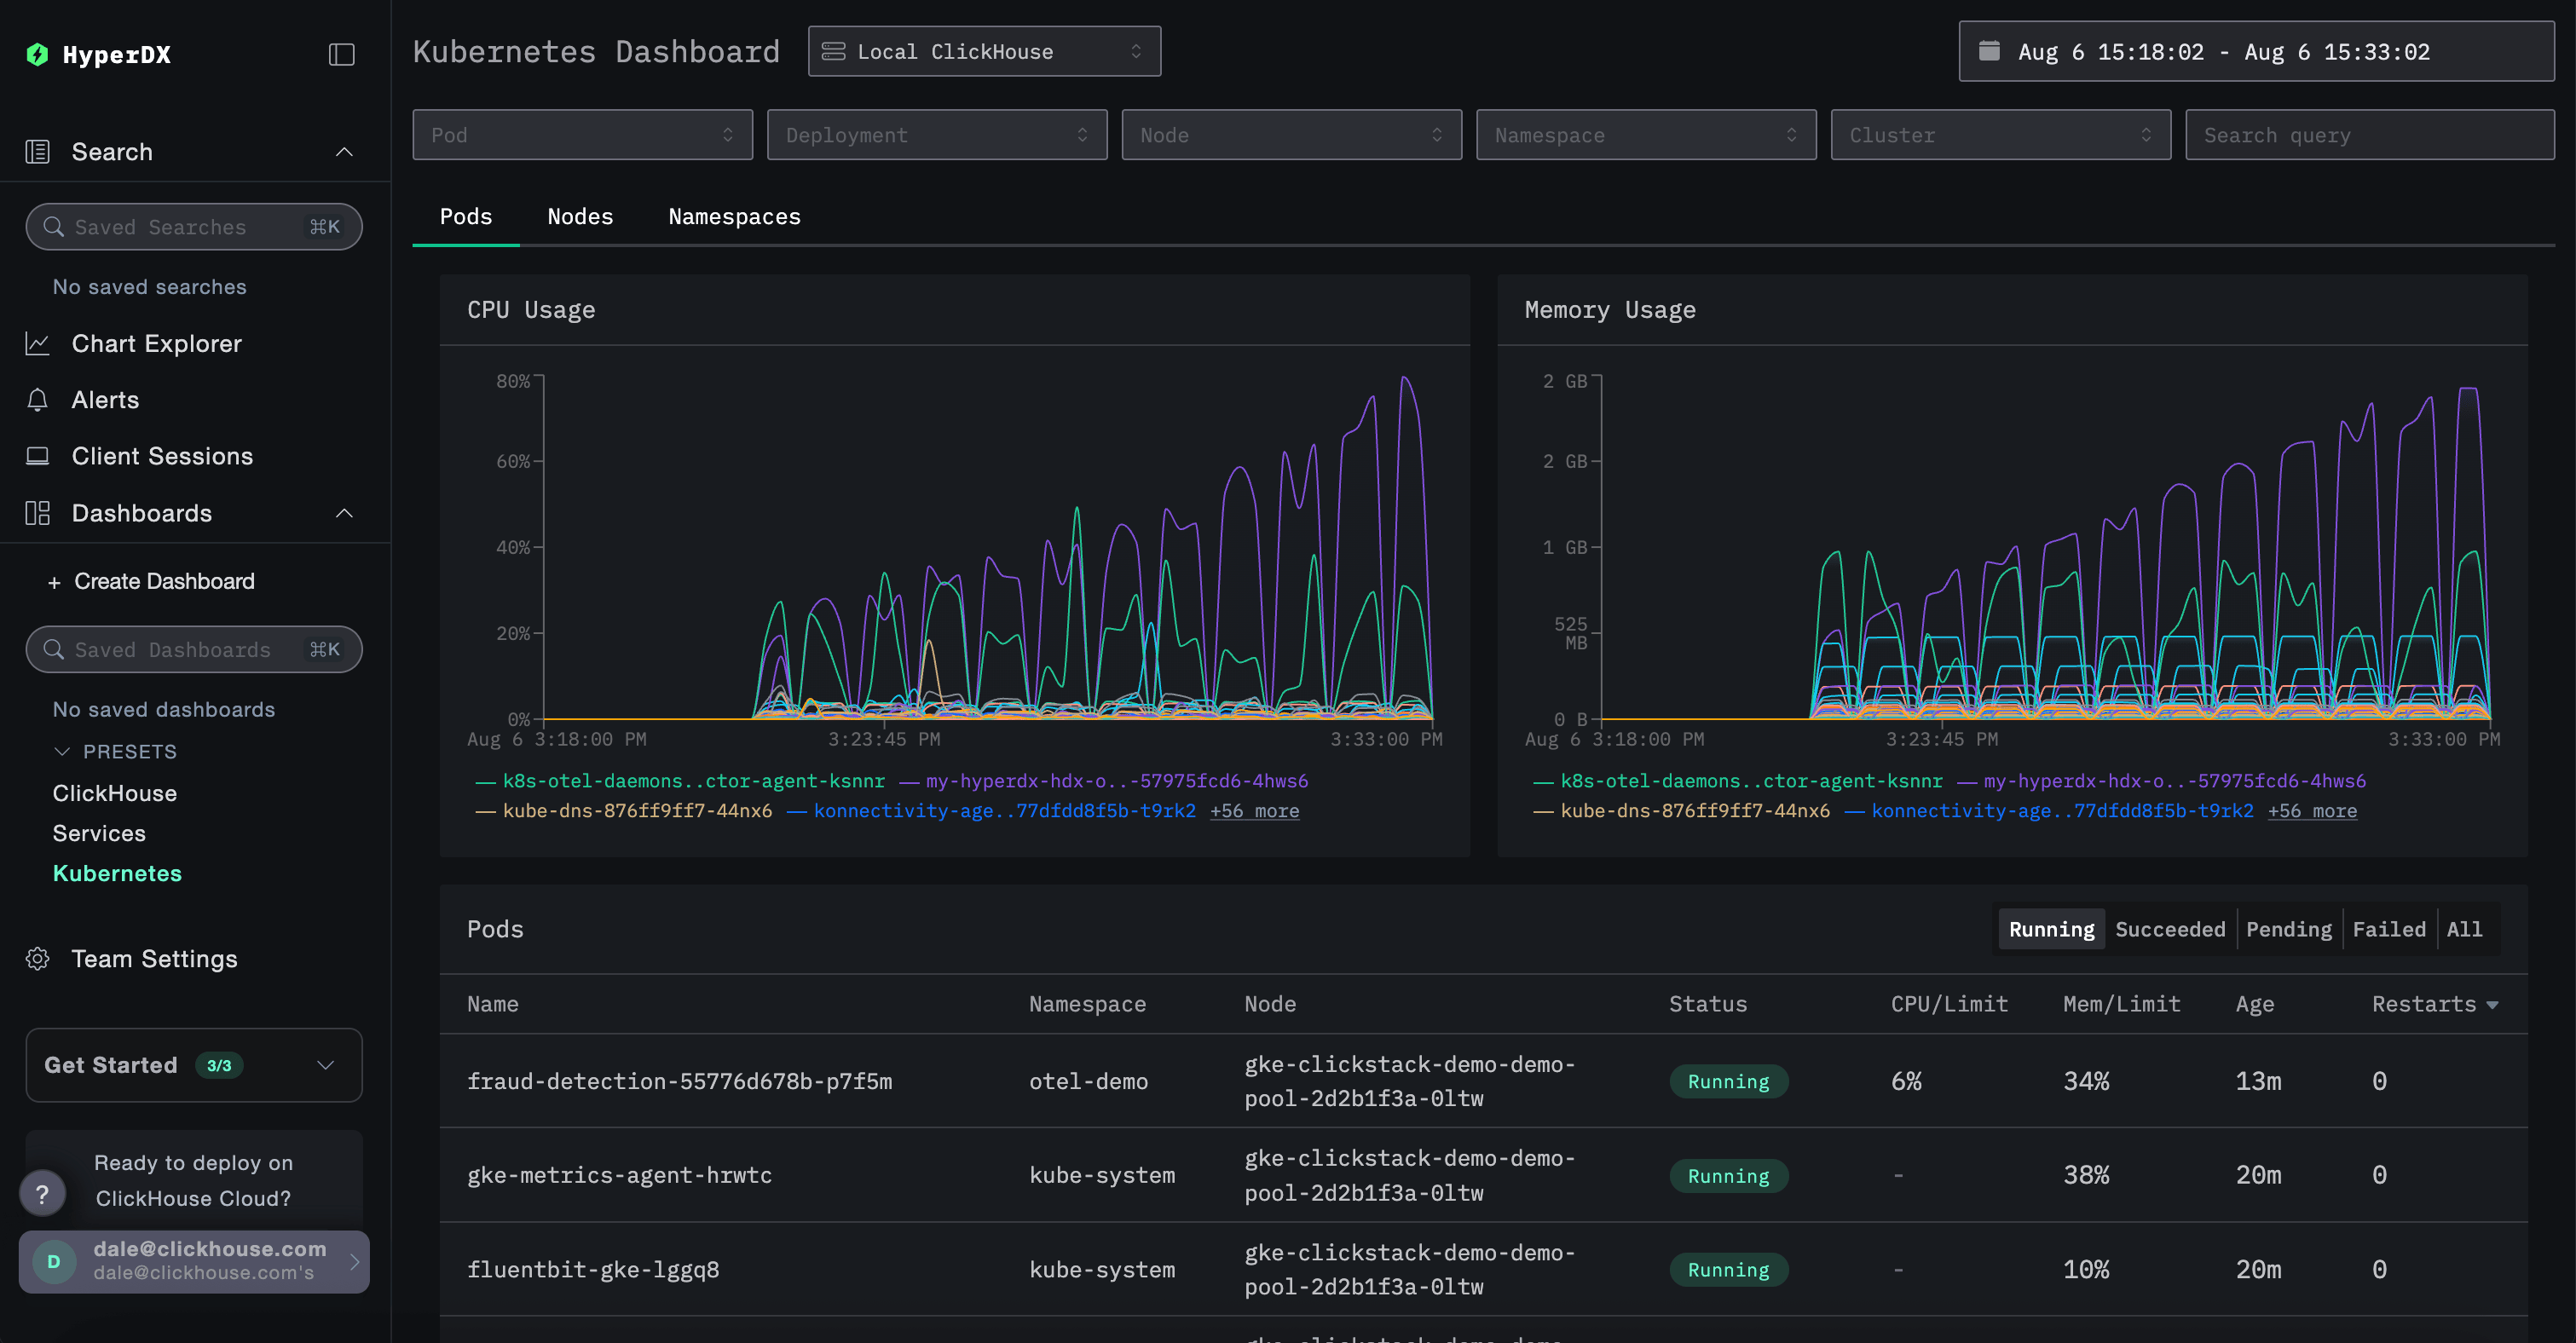
-n otel-demoKubernetes データを確認するには、/kubernetes の専用ダッシュボードに移動します。例: http://localhost:8080/kubernetes
Pods、Nodes、Namespaces の各タブには、それぞれデータが表示されているはずです。