

 Set up docs MCP
이 기능은 Prometheus를 통합하여 ClickHouse Cloud 서비스를 모니터링할 수 있도록 지원합니다. Prometheus 메트릭에 대한 액세스는 ClickHouse Cloud API 엔드포인트를 통해 제공되며, 이 엔드포인트를 사용하면 Prometheus 메트릭 collector에 안전하게 연결하여 메트릭을 내보낼 수 있습니다. 이러한 메트릭은 시각화를 위해 Grafana, Datadog 등의 대시보드와 통합할 수 있습니다.
서비스에 연결된 ClickPipes의 메트릭은 해당 서비스의 ClickHouse 메트릭과 함께 포함됩니다.
시작하려면 API Key를 생성하세요.
ClickHouse Managed Postgres 서비스에 해당하는 엔드포인트를 찾고 있다면 ClickHouse Managed Postgres Prometheus 엔드포인트를 참조하십시오.
ClickHouse Cloud 메트릭을 조회하기 위한 Prometheus 엔드포인트 API
API 참조
| 메서드 | 경로 | 설명 |
|---|---|---|
| GET | https://api.clickhouse.cloud/v1/organizations/:organizationId/services/:serviceId/prometheus?filtered_metrics=[true | false] |
특정 서비스의 메트릭을 반환합니다 |
| GET | https://api.clickhouse.cloud/v1/organizations/:organizationId/prometheus?filtered_metrics=[true | false] |
더 이상 사용되지 않습니다. 조직 내 모든 서비스의 메트릭을 반환합니다 |
| GET | https://api.clickhouse.cloud/v1/organizations/:organizationId/prometheus/discovery?filtered_metrics=[true | false] |
HTTP 서비스 디스커버리 포맷으로 조직 내 모든 서비스의 Prometheus 스크레이프 대상을 반환합니다 |
요청 매개변수
| 이름 | 위치 | 유형 |
|---|---|---|
| 조직 ID | 엔드포인트 | uuid |
| 서비스 ID | 엔드포인트 | uuid (선택 사항) |
| filtered_metrics | 쿼리 매개변수 | boolean (선택 사항) |
이러한 엔드포인트의 전체 요청 및 응답 스키마는 Cloud API 참조에서 확인할 수 있습니다.
인증
기본 인증에는 ClickHouse Cloud API Key를 사용하십시오:
Username: <KEY_ID>
Password: <KEY_SECRET>
Example request
export KEY_SECRET=<key_secret>
export KEY_ID=<key_id>
export ORG_ID=<org_id>

# $ORG_ID의 모든 서비스에 대해
curl --silent --user $KEY_ID:$KEY_SECRET https://api.clickhouse.cloud/v1/organizations/$ORG_ID/prometheus?filtered_metrics=true

# 단일 서비스만 조회
export SERVICE_ID=<service_id>
curl --silent --user $KEY_ID:$KEY_SECRET https://api.clickhouse.cloud/v1/organizations/$ORG_ID/services/$SERVICE_ID/prometheus?filtered_metrics=true
응답 예시
# HELP ClickHouse_ServiceInfo 클러스터 상태 및 ClickHouse 버전을 포함한 서비스 정보
# TYPE ClickHouse_ServiceInfo untyped
ClickHouse_ServiceInfo{clickhouse_org="c2ba4799-a76e-456f-a71a-b021b1fafe60",clickhouse_service="12f4a114-9746-4a75-9ce5-161ec3a73c4c",clickhouse_service_name="test service",clickhouse_cluster_status="running",clickhouse_version="24.5",scrape="full"} 1

# HELP ClickHouseProfileEvents_Query 해석 및 실행 대상 쿼리 수. 파싱 실패 또는 AST 크기 제한, 할당량 제한, 동시 실행 쿼리 수 제한으로 거부된 쿼리는 포함되지 않습니다. ClickHouse 자체에서 시작된 내부 쿼리가 포함될 수 있습니다. 서브쿼리는 카운트되지 않습니다.
# TYPE ClickHouseProfileEvents_Query counter
ClickHouseProfileEvents_Query{clickhouse_org="c2ba4799-a76e-456f-a71a-b021b1fafe60",clickhouse_service="12f4a114-9746-4a75-9ce5-161ec3a73c4c",clickhouse_service_name="test service",hostname="c-cream-ma-20-server-3vd2ehh-0",instance="c-cream-ma-20-server-3vd2ehh-0",table="system.events"} 6

# HELP ClickHouseProfileEvents_QueriesWithSubqueries 모든 서브쿼리를 포함한 쿼리 수
# TYPE ClickHouseProfileEvents_QueriesWithSubqueries counter
ClickHouseProfileEvents_QueriesWithSubqueries{clickhouse_org="c2ba4799-a76e-456f-a71a-b021b1fafe60",clickhouse_service="12f4a114-9746-4a75-9ce5-161ec3a73c4c",clickhouse_service_name="test service",hostname="c-cream-ma-20-server-3vd2ehh-0",instance="c-cream-ma-20-server-3vd2ehh-0",table="system.events"} 230

# HELP ClickHouseProfileEvents_SelectQueriesWithSubqueries 모든 서브쿼리를 포함한 SELECT 쿼리 수
# TYPE ClickHouseProfileEvents_SelectQueriesWithSubqueries counter
ClickHouseProfileEvents_SelectQueriesWithSubqueries{clickhouse_org="c2ba4799-a76e-456f-a71a-b021b1fafe60",clickhouse_service="12f4a114-9746-4a75-9ce5-161ec3a73c4c",clickhouse_service_name="test service",hostname="c-cream-ma-20-server-3vd2ehh-0",instance="c-cream-ma-20-server-3vd2ehh-0",table="system.events"} 224

# HELP ClickHouseProfileEvents_FileOpen 열린 파일 수.
# TYPE ClickHouseProfileEvents_FileOpen counter
ClickHouseProfileEvents_FileOpen{clickhouse_org="c2ba4799-a76e-456f-a71a-b021b1fafe60",clickhouse_service="12f4a114-9746-4a75-9ce5-161ec3a73c4c",clickhouse_service_name="test service",hostname="c-cream-ma-20-server-3vd2ehh-0",instance="c-cream-ma-20-server-3vd2ehh-0",table="system.events"} 4157

# HELP ClickHouseProfileEvents_Seek 'lseek' 함수 호출 횟수.
# TYPE ClickHouseProfileEvents_Seek counter
ClickHouseProfileEvents_Seek{clickhouse_org="c2ba4799-a76e-456f-a71a-b021b1fafe60",clickhouse_service="12f4a114-9746-4a75-9ce5-161ec3a73c4c",clickhouse_service_name="test service",hostname="c-cream-ma-20-server-3vd2ehh-0",instance="c-cream-ma-20-server-3vd2ehh-0",table="system.events"} 1840

# HELP ClickPipes_Info 항상 1입니다. 레이블 "clickpipe_state"에 파이프의 현재 상태가 표시됩니다: Stopped/Provisioning/Running/Paused/Failed
# TYPE ClickPipes_Info gauge
ClickPipes_Info{clickhouse_org="11dfa1ec-767d-43cb-bfad-618ce2aaf959",clickhouse_service="82b83b6a-5568-4a82-aa78-fed9239db83f",clickhouse_service_name="ClickPipes demo instace",clickpipe_id="642bb967-940b-459e-9f63-a2833f62ec44",clickpipe_name="Confluent demo pipe",clickpipe_source="confluent",clickpipe_status="Running"} 1

# HELP ClickPipes_SentEvents_Total ClickHouse로 전송된 총 레코드 수
# TYPE ClickPipes_SentEvents_Total counter
ClickPipes_SentEvents_Total{clickhouse_org="11dfa1ec-767d-43cb-bfad-618ce2aaf959",clickhouse_service="82b83b6a-5568-4a82-aa78-fed9239db83f",clickhouse_service_name="ClickPipes demo instace",clickpipe_id="642bb967-940b-459e-9f63-a2833f62ec44",clickpipe_name="Confluent demo pipe",clickpipe_source="confluent"} 5534250

# HELP ClickPipes_SentBytesCompressed_Total ClickHouse로 전송된 총 압축 바이트 수.
# TYPE ClickPipes_SentBytesCompressed_Total counter
ClickPipes_SentBytesCompressed_Total{clickhouse_org="11dfa1ec-767d-43cb-bfad-618ce2aaf959",clickhouse_service="82b83b6a-5568-4a82-aa78-fed9239db83f",clickhouse_service_name
="ClickPipes demo instace",clickpipe_id="642bb967-940b-459e-9f63-a2833f62ec44",clickpipe_name="Confluent demo pipe",clickpipe_source="confluent"} 380837520
ClickPipes_SentBytesCompressed_Total{clickhouse_org="11dfa1ec-767d-43cb-bfad-618ce2aaf959",clickhouse_service="82b83b6a-5568-4a82-aa78-fed9239db83f",clickhouse_service_name

# HELP ClickPipes_FetchedBytes_Total 소스에서 가져온 총 비압축(uncompressed) 바이트 수.
# TYPE ClickPipes_FetchedBytes_Total counter
ClickPipes_FetchedBytes_Total{clickhouse_org="11dfa1ec-767d-43cb-bfad-618ce2aaf959",clickhouse_service="82b83b6a-5568-4a82-aa78-fed9239db83f",clickhouse_service_name="ClickPipes demo instace",clickpipe_id="642bb967-940b-459e-9f63-a2833f62ec44",clickpipe_name="Confluent demo pipe",clickpipe_source="confluent"} 873286202

# HELP ClickPipes_Errors_Total 데이터 수집 중 발생한 총 오류 수.
# TYPE ClickPipes_Errors_Total counter
ClickPipes_Errors_Total{clickhouse_org="11dfa1ec-767d-43cb-bfad-618ce2aaf959",clickhouse_service="82b83b6a-5568-4a82-aa78-fed9239db83f",clickhouse_service_name="ClickPipes demo instace",clickpipe_id="642bb967-940b-459e-9f63-a2833f62ec44",clickpipe_name="Confluent demo pipe",clickpipe_source="confluent"} 0

# HELP ClickPipes_SentBytes_Total ClickHouse로 전송된 총 비압축(uncompressed) 바이트 수.
# TYPE ClickPipes_SentBytes_Total counter
ClickPipes_SentBytes_Total{clickhouse_org="11dfa1ec-767d-43cb-bfad-618ce2aaf959",clickhouse_service="82b83b6a-5568-4a82-aa78-fed9239db83f",clickhouse_service_name="ClickPipes demo instace",clickpipe_id="642bb967-940b-459e-9f63-a2833f62ec44",clickpipe_name="Confluent demo pipe",clickpipe_source="confluent"} 477187967

# HELP ClickPipes_FetchedBytesCompressed_Total 소스에서 가져온 총 압축 바이트 수. 소스 데이터가 비압축 상태인 경우 ClickPipes_FetchedBytes_Total과 동일합니다.
# TYPE ClickPipes_FetchedBytesCompressed_Total counter
ClickPipes_FetchedBytesCompressed_Total{clickhouse_org="11dfa1ec-767d-43cb-bfad-618ce2aaf959",clickhouse_service="82b83b6a-5568-4a82-aa78-fed9239db83f",clickhouse_service_name="ClickPipes demo instace",clickpipe_id="642bb967-940b-459e-9f63-a2833f62ec44",clickpipe_name="Confluent demo pipe",clickpipe_source="confluent"} 873286202

# HELP ClickPipes_FetchedEvents_Total 소스에서 가져온 레코드의 총 수.
# TYPE ClickPipes_FetchedEvents_Total counter
ClickPipes_FetchedEvents_Total{clickhouse_org="11dfa1ec-767d-43cb-bfad-618ce2aaf959",clickhouse_service="82b83b6a-5568-4a82-aa78-fed9239db83f",clickhouse_service_name="ClickPipes demo instace",clickpipe_id="642bb967-940b-459e-9f63-a2833f62ec44",clickpipe_name="Confluent demo pipe",clickpipe_source="confluent"} 5535376
메트릭 레이블
모든 메트릭에는 다음 레이블이 포함됩니다:
| 레이블 | 설명 |
|---|---|
| clickhouse_org | 조직 ID |
| clickhouse_service | 서비스 ID |
| clickhouse_service_name | 서비스 이름 |
ClickPipes의 경우 메트릭에 다음 레이블도 포함됩니다:
| 레이블 | 설명 |
|---|---|
| clickpipe_id | ClickPipe ID |
| clickpipe_name | ClickPipe 이름 |
| clickpipe_source | ClickPipe 소스 유형 |
정보 메트릭
ClickHouse Cloud는 값이 항상 1인 gauge 타입의 특수 메트릭 ClickHouse_ServiceInfo를 제공합니다. 이 메트릭에는 모든 메트릭 레이블과 함께 다음 레이블이 포함됩니다:
| Label | Description |
|---|---|
| clickhouse_cluster_status | 서비스의 상태입니다. 다음 값 중 하나일 수 있습니다: [awaking |
| clickhouse_version | 서비스에서 실행 중인 ClickHouse 서버의 버전 |
| scrape | 마지막 스크레이프의 상태를 나타냅니다. full 또는 partial일 수 있습니다 |
| full | 마지막 메트릭 스크레이프 중 오류가 없었음을 나타냅니다 |
| partial | 마지막 메트릭 스크레이프 중 일부 오류가 발생하여 ClickHouse_ServiceInfo 메트릭만 반환되었음을 나타냅니다. |
메트릭을 조회하는 요청은 유휴 상태(idle)인 서비스를 재개하지 않습니다. 서비스가 idle 상태인 경우에는 ClickHouse_ServiceInfo 메트릭만 반환됩니다.
ClickPipes의 경우에도 이와 유사하게 ClickPipes_Info라는 gauge 메트릭이 있으며, 메트릭 레이블 외에 다음 레이블을 포함합니다:
| Label | Description |
|---|---|
| clickpipe_state | 파이프의 현재 상태 |
Prometheus 구성
Prometheus 서버는 지정된 인터벌마다 구성된 대상에서 메트릭을 수집합니다. 아래는 ClickHouse Cloud Prometheus 엔드포인트를 사용하도록 Prometheus 서버를 구성하는 예시입니다.
global:
  scrape_interval: 15s

scrape_configs:
  - job_name: "prometheus"
    static_configs:
    - targets: ["localhost:9090"]
  - job_name: "clickhouse"
    static_configs:
      - targets: ["api.clickhouse.cloud"]
    scheme: https
    params:
      filtered_metrics: ["true"]
    metrics_path: "/v1/organizations/<ORG_ID>/prometheus"
    basic_auth:
      username: <KEY_ID>
      password: <KEY_SECRET>
    honor_labels: true
honor_labels 구성 매개변수는 인스턴스 레이블 값이 올바르게 채워지도록 true로 설정해야 합니다. 또한 위 예시에서는 filtered_metrics를 true로 설정했지만, 이는 사용자 선호에 따라 구성해야 합니다.
자동 서비스 디스커버리
디스커버리 엔드포인트는 조직 내 서비스별로 하나의 스크레이프 대상을 Prometheus HTTP 서비스 디스커버리 (http_sd) 포맷으로 반환합니다. Prometheus는 디스커버리 폴링마다 대상 목록을 갱신하고 발견된 각 대상을 스크레이프하므로, 새로 생성된 서비스는 자동으로 포함되고 삭제된 서비스는 대상 목록에서 제거됩니다. API Key에 해당 서비스를 볼 권한이 있는 경우에만 포함되며, 삭제 중이거나 이미 삭제된 서비스는 제외됩니다.
사용하려면 http_sd_configs job에서 디스커버리 엔드포인트를 지정하십시오:
global:
  scrape_interval: 15s

scrape_configs:
  - job_name: "clickhouse"
    http_sd_configs:
      - url: https://api.clickhouse.cloud/v1/organizations/<ORG_ID>/prometheus/discovery
        refresh_interval: 60s
        basic_auth:
          username: <KEY_ID>
          password: <KEY_SECRET>
    basic_auth:
      username: <KEY_ID>
      password: <KEY_SECRET>
    honor_labels: true
두 곳 모두에 basic_auth를 설정합니다. http_sd_configs 아래의 블록은 디스커버리 폴링을 인증하고, 스크레이프 작업의 블록은 서비스별 메트릭 스크레이프를 인증합니다. 정적 구성과 마찬가지로 instance 레이블이 올바르게 설정되도록 honor_labels: true를 지정합니다.
디스커버리 응답 예시:
[
  {
    "targets": ["api.clickhouse.cloud"],
    "labels": {
      "__scheme__": "https",
      "__metrics_path__": "/v1/organizations/<ORG_ID>/services/<SERVICE_ID>/prometheus",
      "__param_filtered_metrics": "true",
      "clickhouse_org_id": "<ORG_ID>",
      "clickhouse_service_id": "<SERVICE_ID>",
      "clickhouse_discovery_service_name": "my service"
    }
  }
]
디스커버리를 통해 발견된 대상은 filtered_metrics=true로 스크레이프됩니다. 전체 메트릭 세트를 스크레이프하는 대상을 발견하려면 디스커버리 URL에 ?filtered_metrics=false를 추가하십시오. 전체 엔드포인트 사양은 Cloud API 참조에서 확인할 수 있습니다.
Grafana와 통합하기
Grafana와 통합하는 주요 방법은 두 가지입니다.
- 메트릭 엔드포인트 – 이 방식의 장점은 추가 구성 요소나 인프라가 필요 없다는 점입니다. 이 옵션은 Grafana Cloud에서만 사용할 수 있으며, ClickHouse Cloud Prometheus 엔드포인트 URL과 자격 증명만 있으면 됩니다.
- Grafana Alloy - Grafana Alloy는 Grafana Agent를 대체하는 공급업체 중립적 OpenTelemetry(OTel) collector 배포판입니다. 스크레이퍼로 사용할 수 있고 자체 인프라에 배포할 수 있으며, 모든 Prometheus 엔드포인트와 호환됩니다.
아래에서는 이러한 옵션을 사용하는 방법을 설명하며, ClickHouse Cloud Prometheus 엔드포인트와 관련된 세부 사항을 중심으로 다룹니다.
Grafana Cloud와 메트릭 엔드포인트
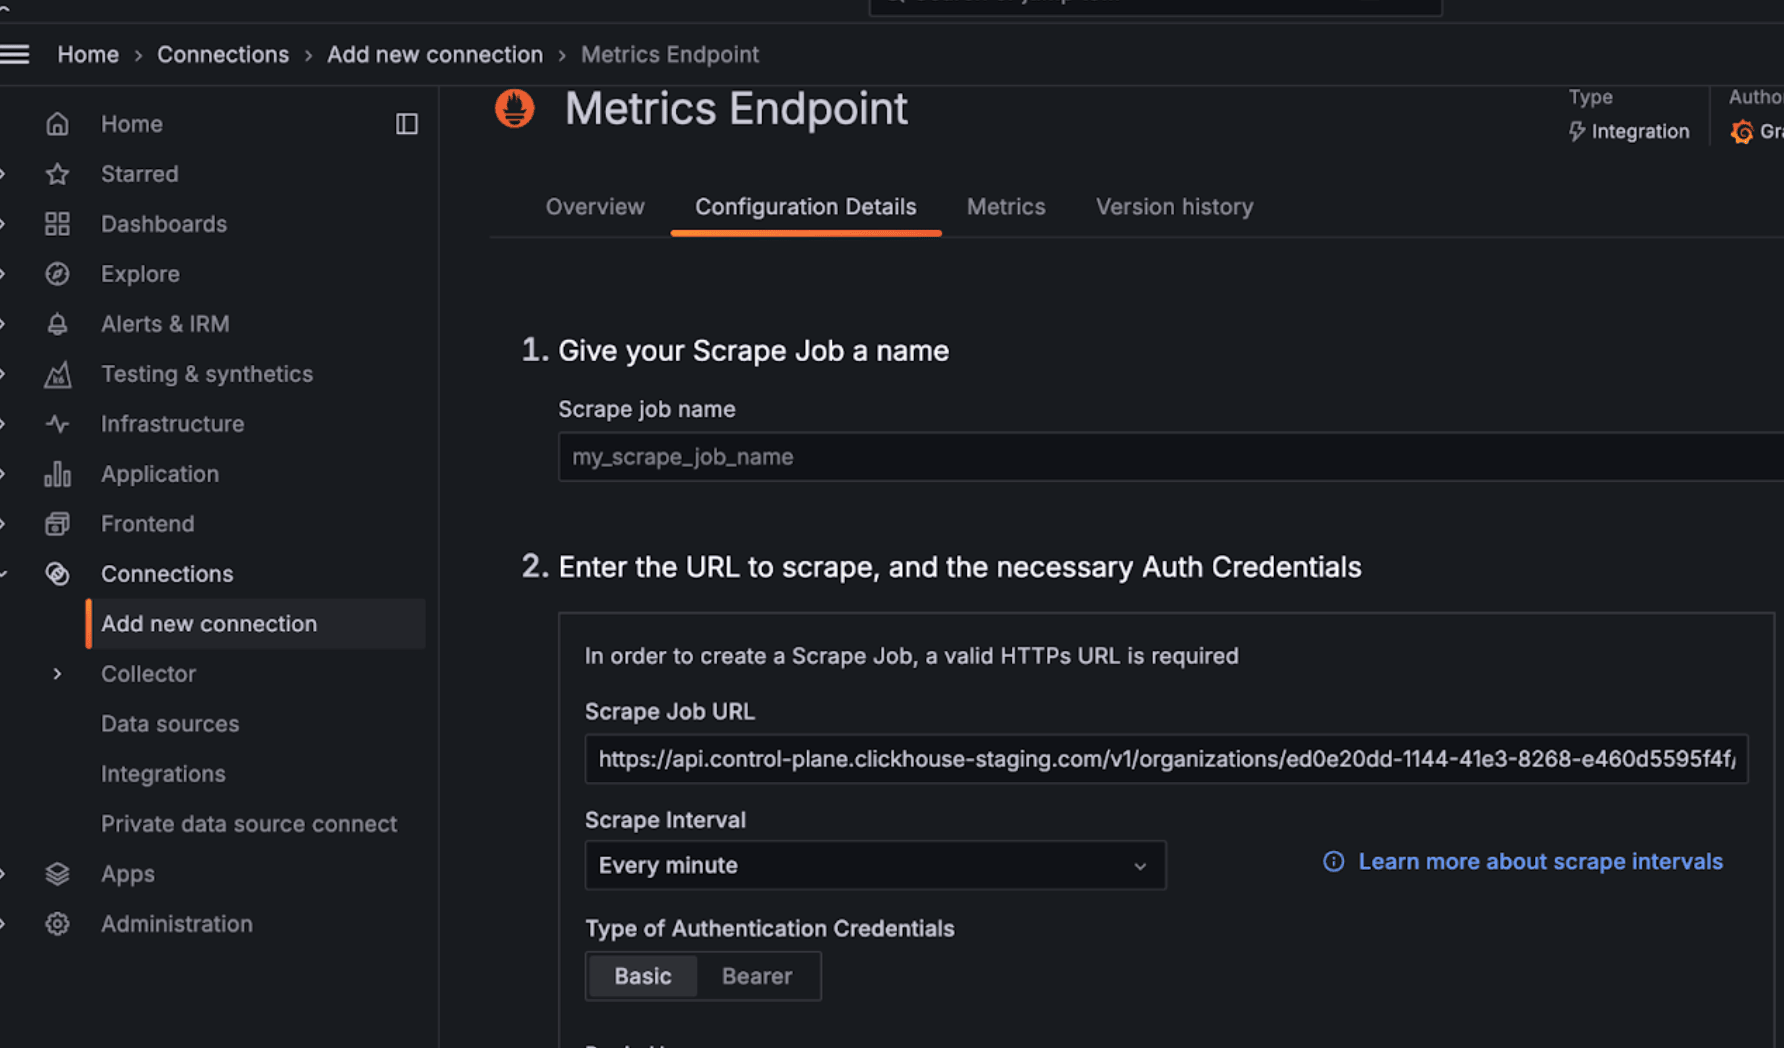
- Grafana Cloud 계정에 로그인하세요
- 메트릭 엔드포인트를 선택하여 새 연결을 추가하세요
- Scrape URL이 Prometheus 엔드포인트를 가리키도록 구성하고, 기본 인증을 사용해 API Key/secret으로 연결을 설정하세요
- 연결을 테스트하여 정상적으로 접속되는지 확인하세요
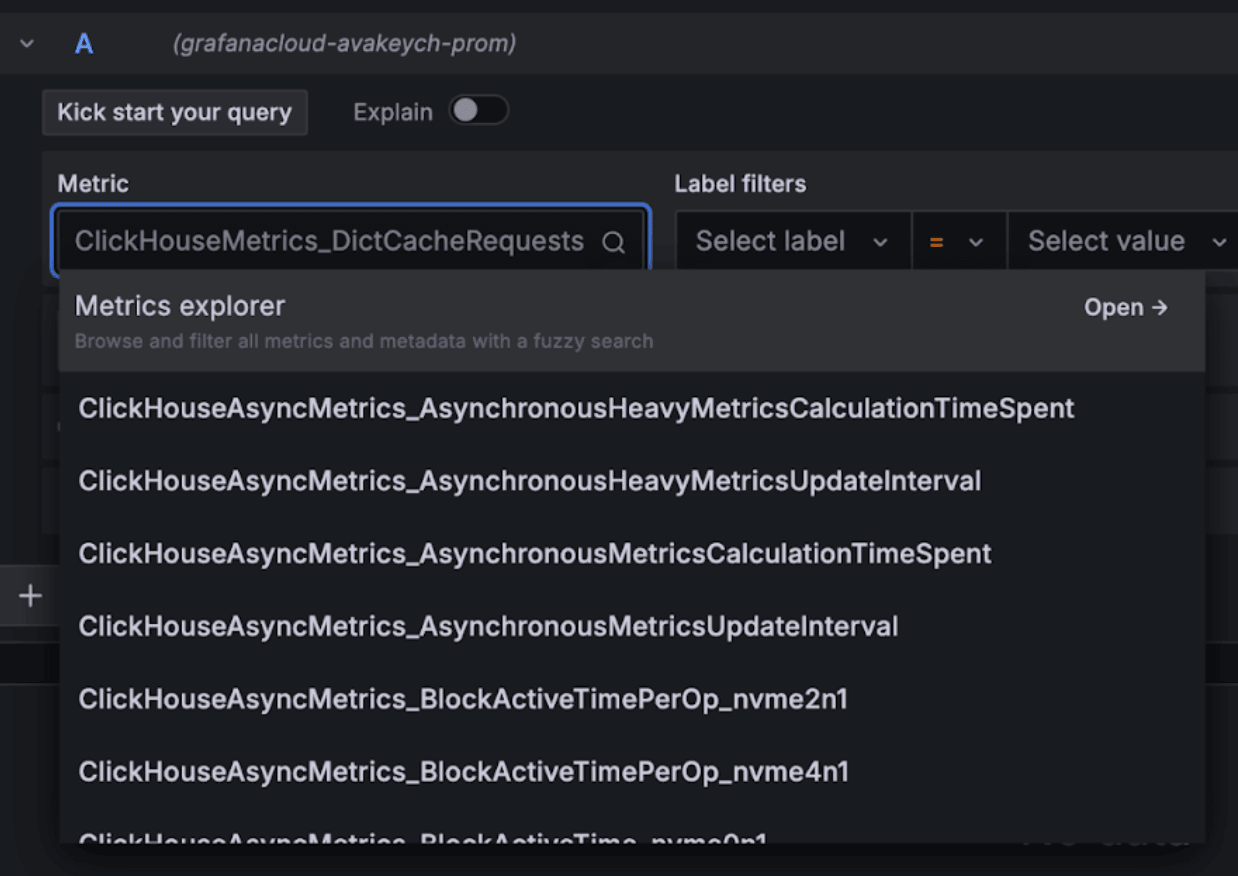
구성이 완료되면 대시보드 구성에 사용할 수 있도록 선택 가능한 드롭다운에 메트릭이 표시됩니다:
Alloy를 사용하는 Grafana Cloud
Grafana Cloud를 사용 중이라면 Grafana에서 Alloy 메뉴로 이동한 후, 화면의 안내에 따라 Alloy를 설치할 수 있습니다:
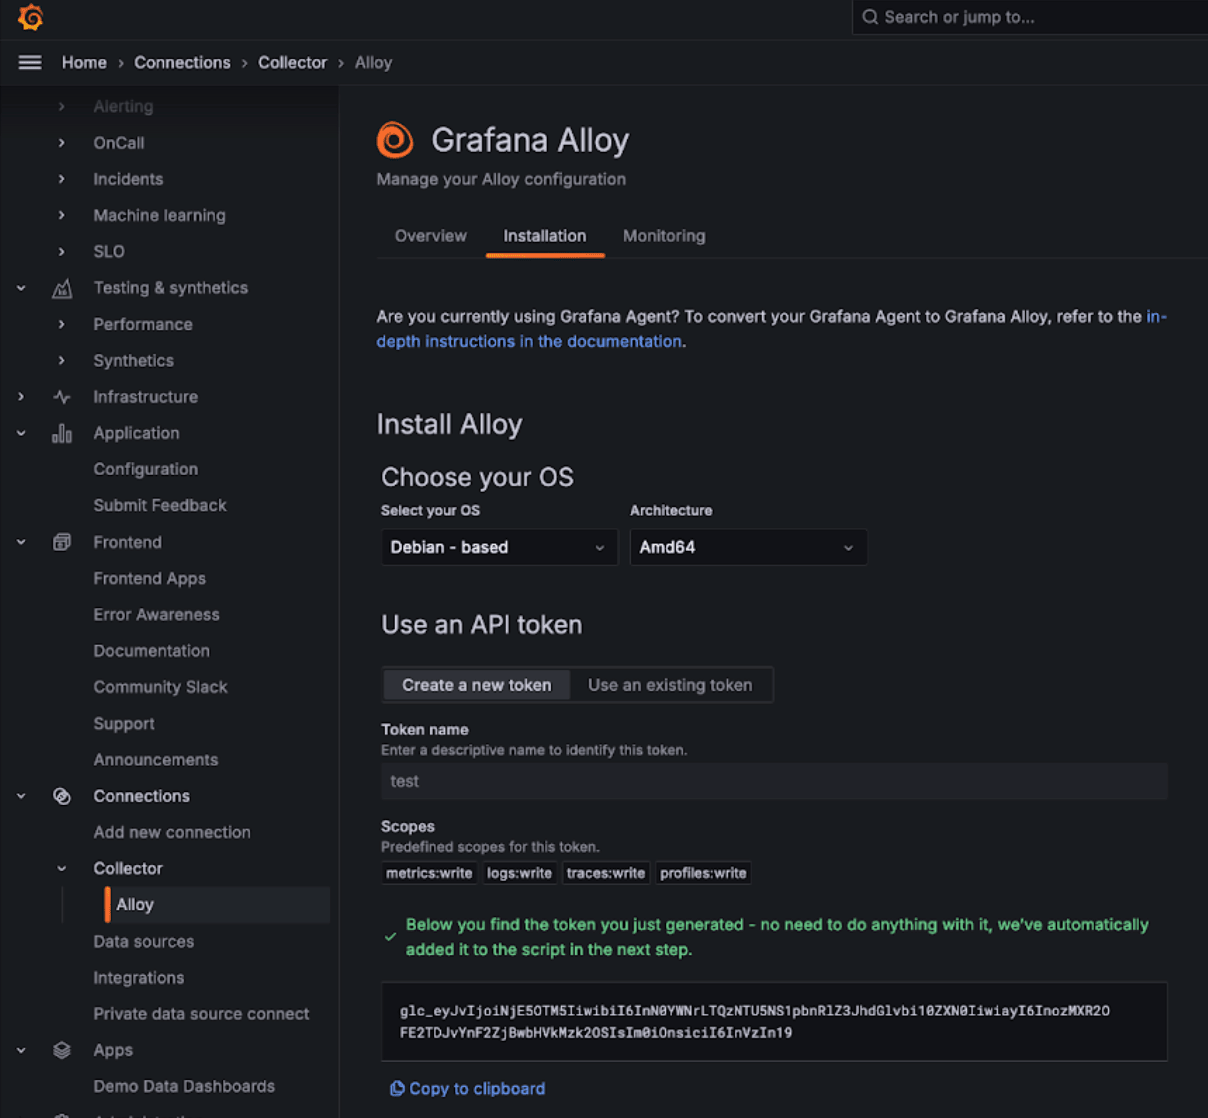
이렇게 하면 인증 토큰을 사용해 Grafana Cloud 엔드포인트로 데이터를 전송하는 prometheus.remote_write 컴포넌트가 포함되도록 Alloy가 구성됩니다. 이후에는 ClickHouse Cloud Prometheus 엔드포인트를 위한 스크레이퍼가 포함되도록 Alloy 구성(Linux에서는 /etc/alloy/config.alloy에 있음)만 수정하면 됩니다.
다음은 ClickHouse Cloud 엔드포인트에서 메트릭을 스크레이프하기 위한 prometheus.scrape 컴포넌트와 자동으로 구성된 prometheus.remote_write 컴포넌트가 포함된 Alloy 구성 예시입니다. basic_auth 구성 컴포넌트에는 각각 사용자 이름과 비밀번호로 Cloud API Key ID와 시크릿이 포함된다는 점에 유의하십시오.
prometheus.scrape "clickhouse_cloud" {
  targets = [{
  __address__ = "api.clickhouse.cloud",
  }]

  scheme       = "https"
  metrics_path = "/v1/organizations/<clickhouse_org_id>/prometheus"

  params = {
  "filtered_metrics" = ["true"],
  }

  honor_labels    = true
  scrape_interval = "30s"
  scrape_timeout  = "25s"

  basic_auth {
  username = "<clickhouse_api_key_id>"
  password = "<clickhouse_api_key_secret>"
  }

  forward_to = [prometheus.remote_write.grafana_cloud.receiver]
}

  prometheus.remote_write "grafana_cloud" {
  endpoint {
  url = "https://<grafana_prometheus_url>/api/prom/push"

  basic_auth {
  username = "<grafana_username>"
  password = "<grafana_api_token>"
  }
  }
}
instance 레이블이 올바르게 채워지려면 honor_labels 구성 매개변수를 true로 설정해야 합니다.
Alloy를 사용하는 자가 관리형 Grafana
자가 관리형 Grafana 사용자는 Alloy 에이전트 설치 지침을 여기에서 확인할 수 있습니다. Alloy가 Prometheus 메트릭을 원하는 대상으로 전송하도록 이미 구성되어 있다고 가정합니다. 아래의 prometheus.scrape 컴포넌트는 Alloy가 ClickHouse Cloud 엔드포인트를 스크레이프하게 합니다. prometheus.remote_write가 스크레이프된 메트릭을 수신한다고 가정합니다. 이 구성이 없다면 forward_to key를 대상에 맞게 조정하십시오.
// prometheus.scrape component causes Alloy to scrape the ClickHouse Cloud Prometheus endpoint.
  // Adjust the forward_to key to match your remote_write receiver if it differs.
  prometheus.scrape "clickhouse_cloud" {
  targets = [{
  __address__ = "api.clickhouse.cloud",
  }]

  scheme       = "https"
  metrics_path = "/v1/organizations/<organizationId>/prometheus"

  params = {
  "filtered_metrics" = ["true"],
  }

  honor_labels = true

  basic_auth {
  username = "<KEY_ID>"
  password = "<KEY_SECRET>"
  }

  forward_to = [prometheus.remote_write.metrics_service.receiver]
}
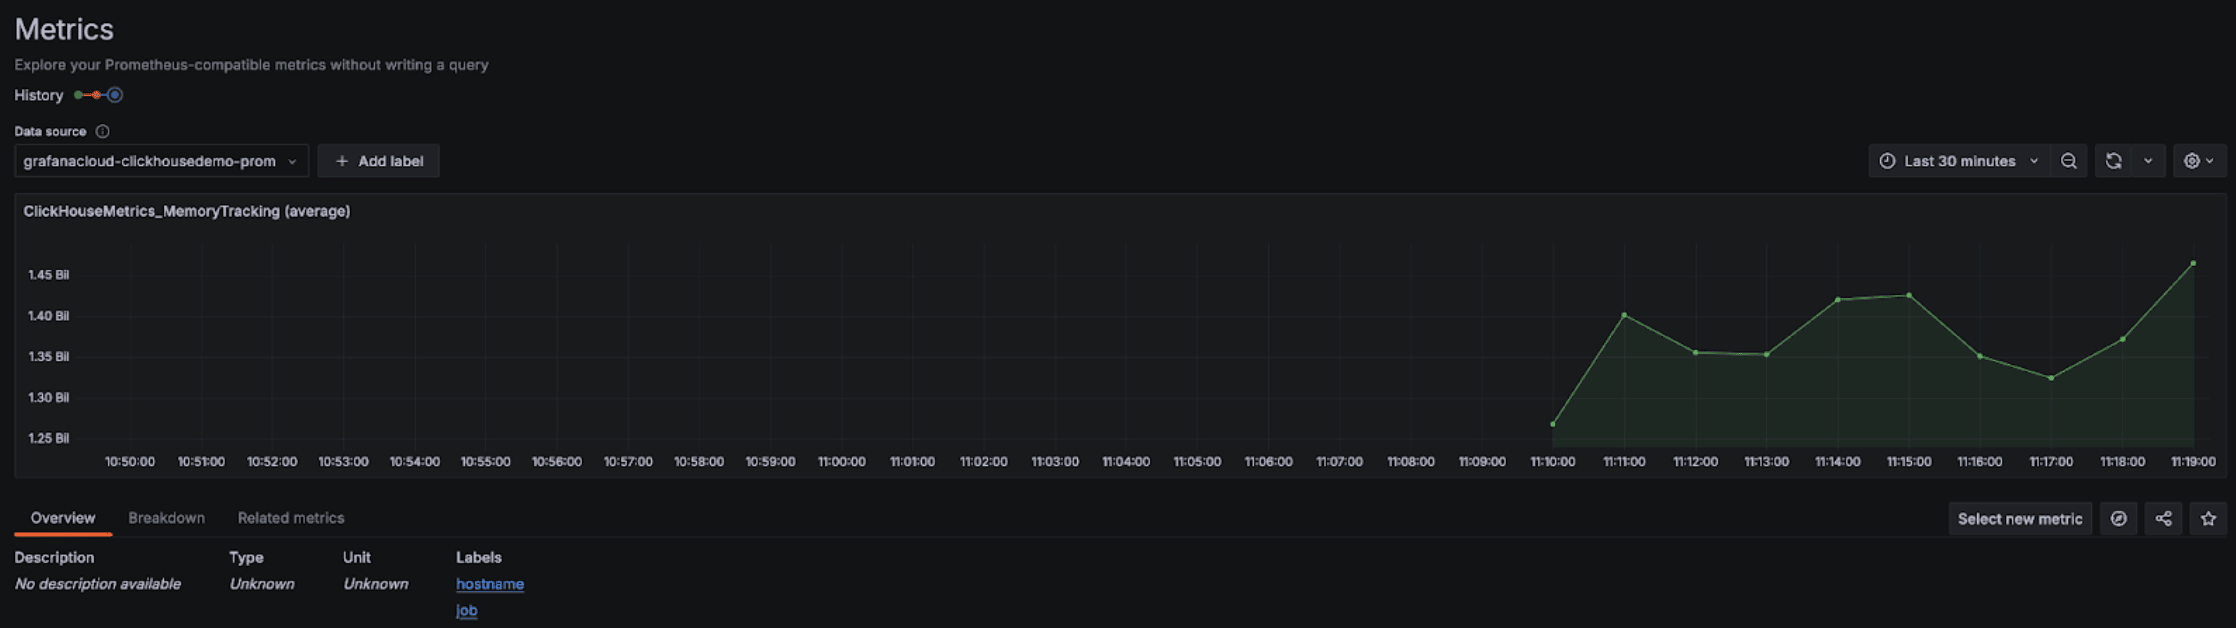
설정이 완료되면 메트릭 탐색기에서 ClickHouse 관련 메트릭을 확인할 수 있습니다:
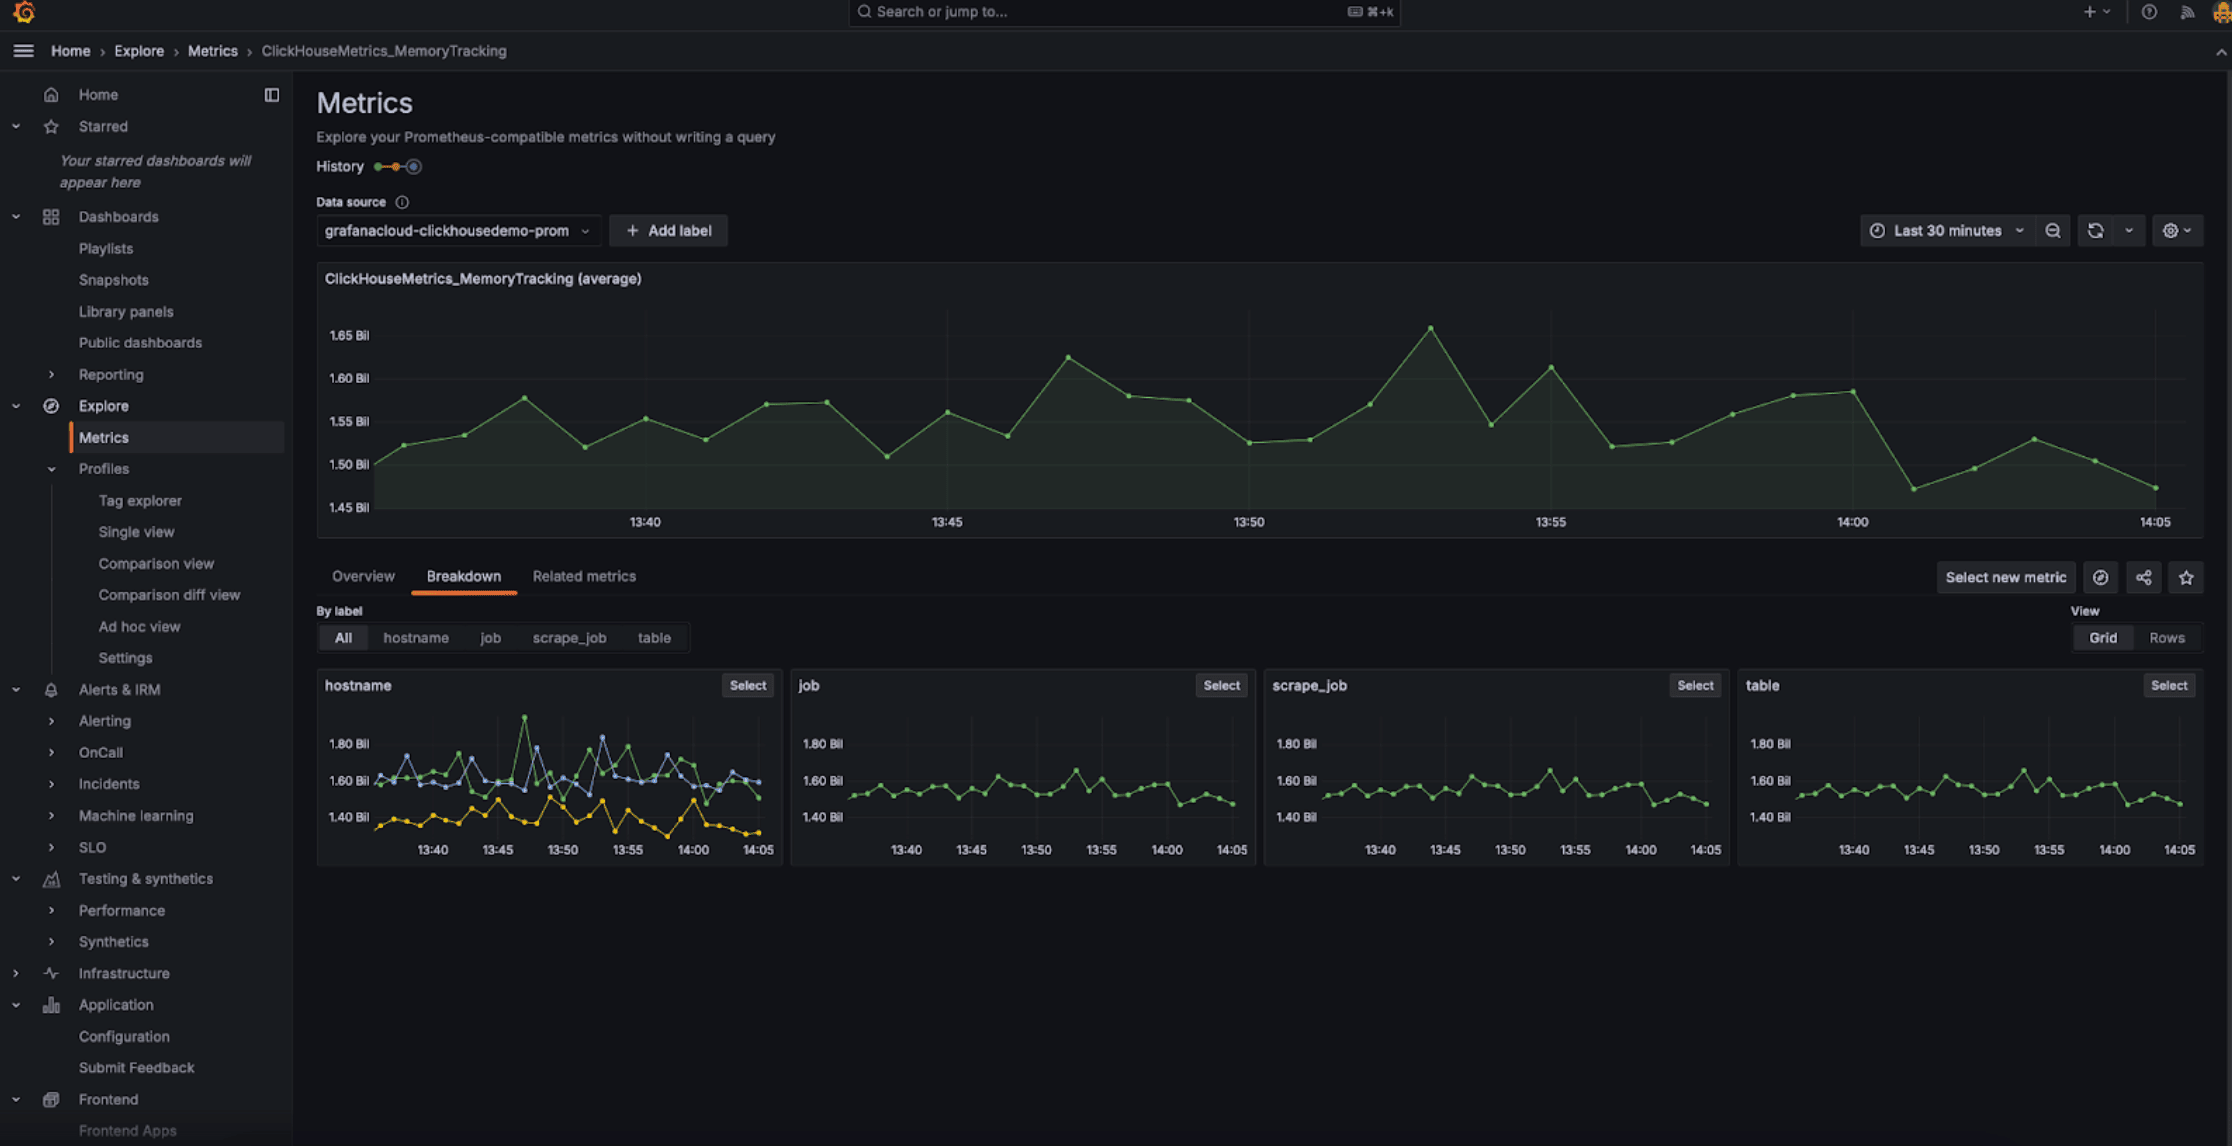
인스턴스 레이블이 올바르게 채워지려면 honor_labels 구성 매개변수를 true로 설정해야 합니다.
Datadog와 통합하기
Datadog Agent와 OpenMetrics 통합을 사용해 ClickHouse Cloud 엔드포인트에서 메트릭을 수집할 수 있습니다. 아래에는 이 Agent와 통합에 대한 간단한 예시 구성이 나와 있습니다. 다만, 실제로는 가장 필요한 메트릭만 선별하는 것이 좋습니다. 아래의 일괄 예시는 수천 개의 메트릭-인스턴스 조합을 내보내며, Datadog는 이를 커스텀 메트릭으로 처리합니다.
init_config:

instances:
   - openmetrics_endpoint: 'https://api.clickhouse.cloud/v1/organizations/97a33bdb-4db3-4067-b14f-ce40f621aae1/prometheus?filtered_metrics=true'
     namespace: 'clickhouse'
     metrics:
         - '^ClickHouse.*'
     username: username
     password: password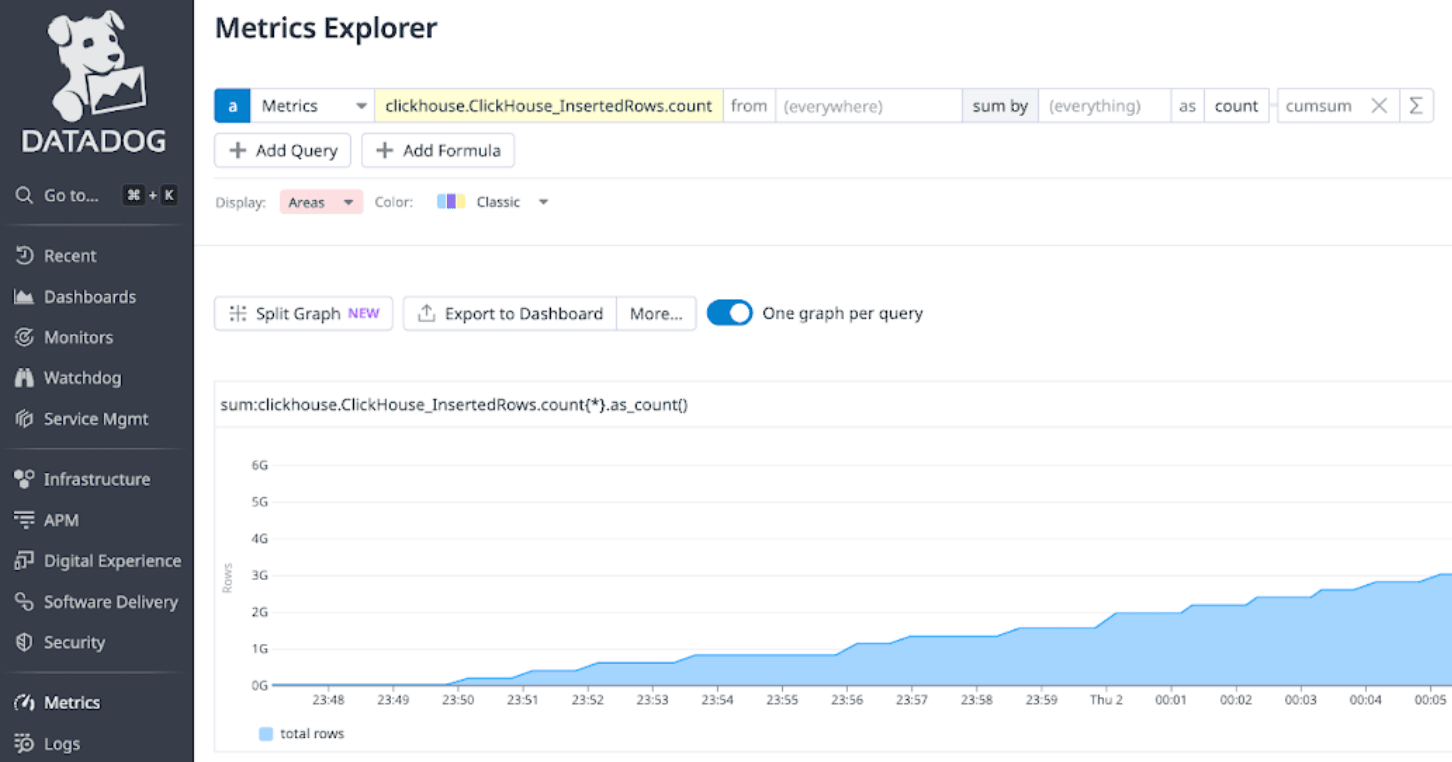
- 모니터링 개요 — ClickHouse Cloud의 모든 모니터링 방법을 비교합니다
- Cloud Console 모니터링 — 외부 도구 없이 사용할 수 있는 기본 제공 대시보드
- 커뮤니티 및 파트너 통합 — Datadog agent 통합 및 커뮤니티 솔루션
- 시스템 테이블 쿼리 — 시스템 메트릭에 SQL로 직접 액세스
- ClickHouse Managed Postgres Prometheus 엔드포인트 — ClickHouse Managed Postgres 서비스의 메트릭을 스크레이프합니다