Set up docs MCP
简介
ClickHouse 处理查询的速度极快,但这些查询是如何 在多台服务器之间分发并并行处理的?
在本指南中,我们将先介绍 ClickHouse 如何通过 分布式表将查询分发到多个分片,然后再说明一个查询如何利用 多个副本来执行。
在 shared-nothing 架构中,集群通常会拆分为 多个分片,每个分片都包含整体数据的一个子集。分布式表 位于这些分片之上,为完整数据提供统一视图。
读取请求既可以发送到本地表,此时查询只会在 指定分片上执行;也可以发送到分布式表,在这种情况下, 每个分片都会执行相应的查询。被查询的分布式表所在服务器 会对数据进行聚合,并向客户端返回响应:
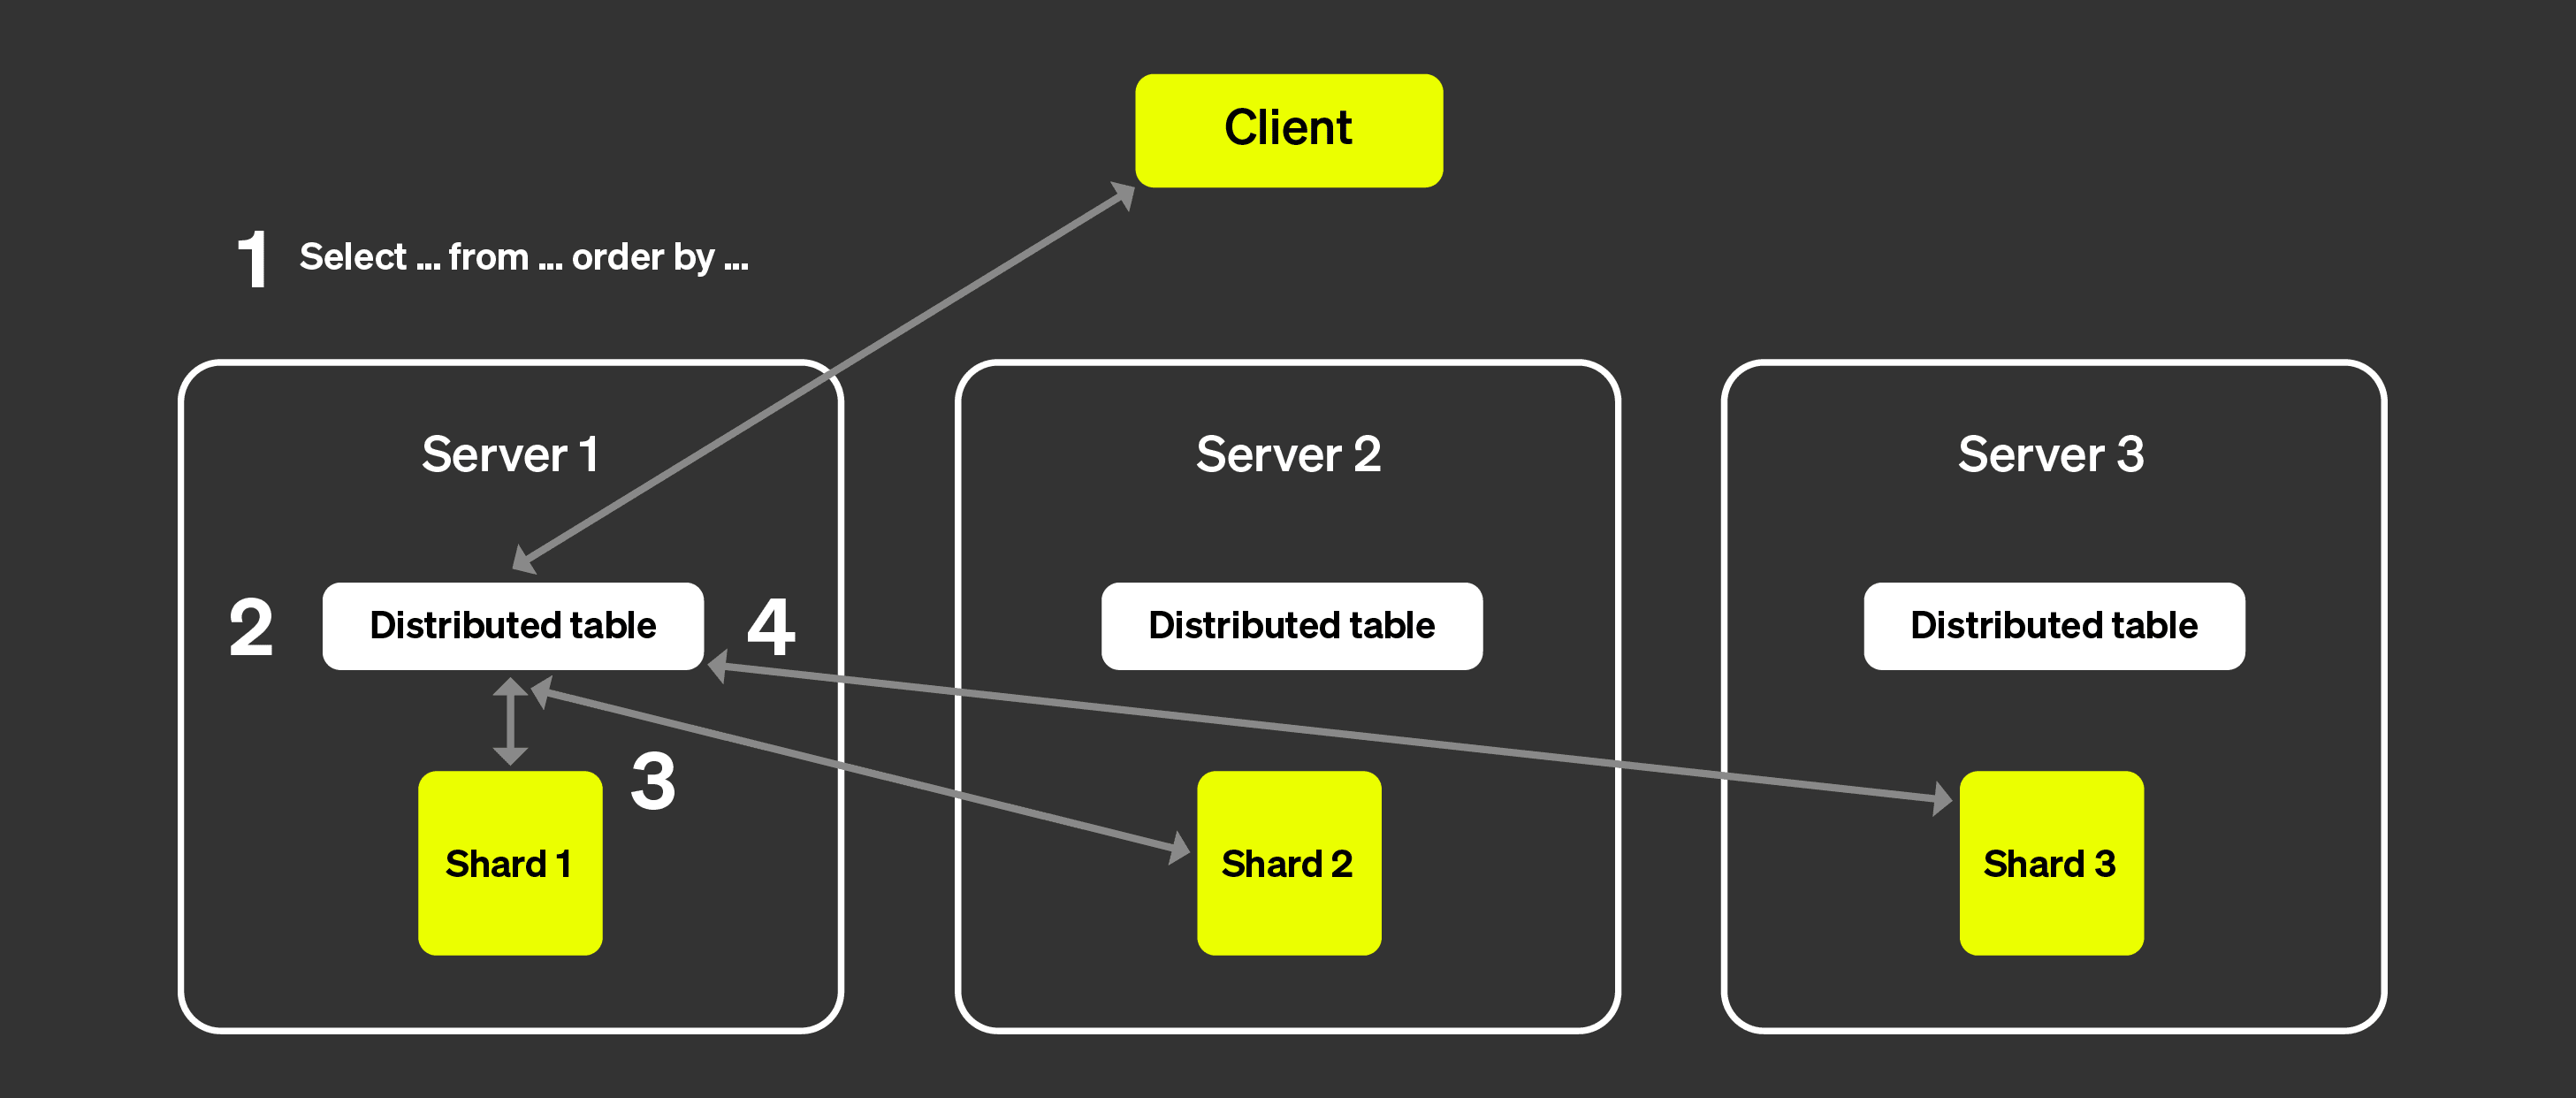
上图展示了客户端查询分布式表时会发生什么:
SELECT查询会先被发送到某个节点上的分布式表, 这个节点可以是随机选中的 (通过轮询策略) ,也可以由负载均衡器 路由到特定服务器。此时,该节点将充当协调器。该节点会根据分布式表中指定的信息,定位每个需要执行查询的分片, 然后将查询发送到各个分片。
每个分片都会在本地读取、过滤并聚合数据, 然后将可合并状态返回给协调器。
协调器会合并数据,然后将响应返回给客户端。
加入副本后,整体流程基本相同,唯一 的区别是每个分片中只会有一个副本执行该查询。 这意味着可以并行处理更多查询。
非分片架构
ClickHouse Cloud 的架构与上文介绍的架构有很大不同。 (更多详情请参见"ClickHouse Cloud Architecture"。) 借助计算与存储分离,以及几乎无限的 存储容量,对分片的需求已不再那么重要。
下图展示了 ClickHouse Cloud 的架构:
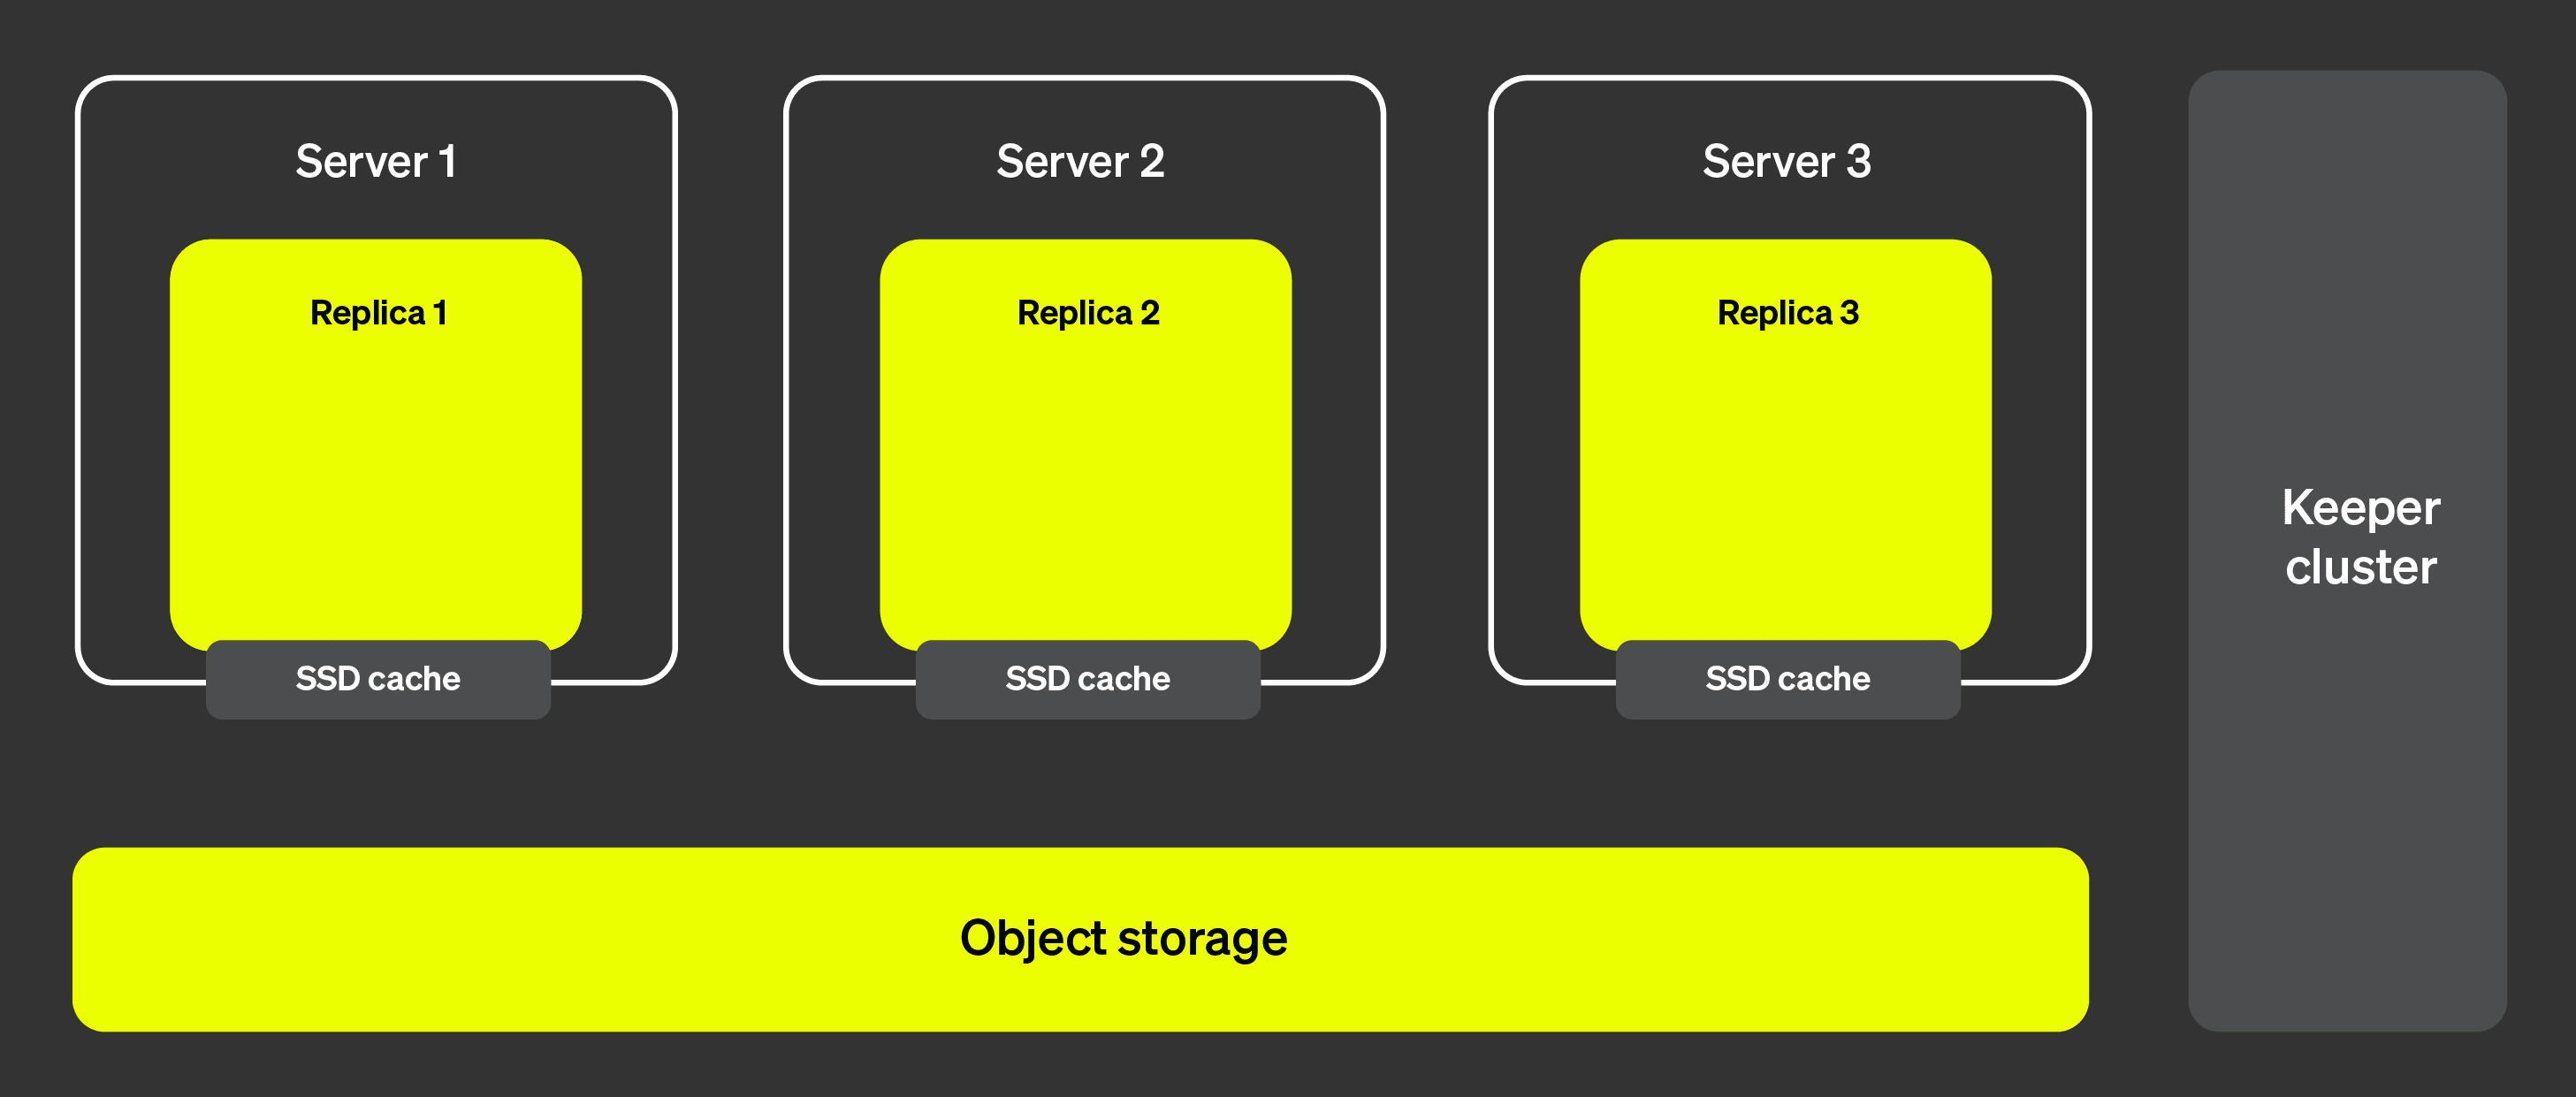
这种架构让我们几乎可以瞬间添加和移除副本, 从而确保集群具备极高的可扩展性。右侧所示的 ClickHouse Keeper 集群为元数据提供了单一事实来源。 副本可以从 ClickHouse Keeper 集群拉取元数据,并保持相同的数据。数据本身存储在 对象存储中,而 SSD 缓存则可以加速查询。
但现在,我们如何将查询执行分布到多个服务器上呢?在 分片架构中,这一点很容易理解,因为每个分片实际上都可以 在部分数据子集上执行查询。那么在没有分片的情况下,它是如何工作的呢?
介绍并行副本
要通过多台服务器并行执行查询,首先需要能够将其中一台服务器指定为协调器。协调器负责创建待执行的任务列表,确保这些任务全部得到执行、完成聚合,并将结果返回给客户端。与大多数分布式系统一样,这一角色通常由接收初始查询的节点承担。我们还需要定义工作单元。在分片架构中,工作单元是分片,即数据的一个子集。而在并行副本中,我们将使用表中的一小部分,也就是粒度,作为工作单元。
现在,让我们借助下图看看它在实际中是如何工作的:
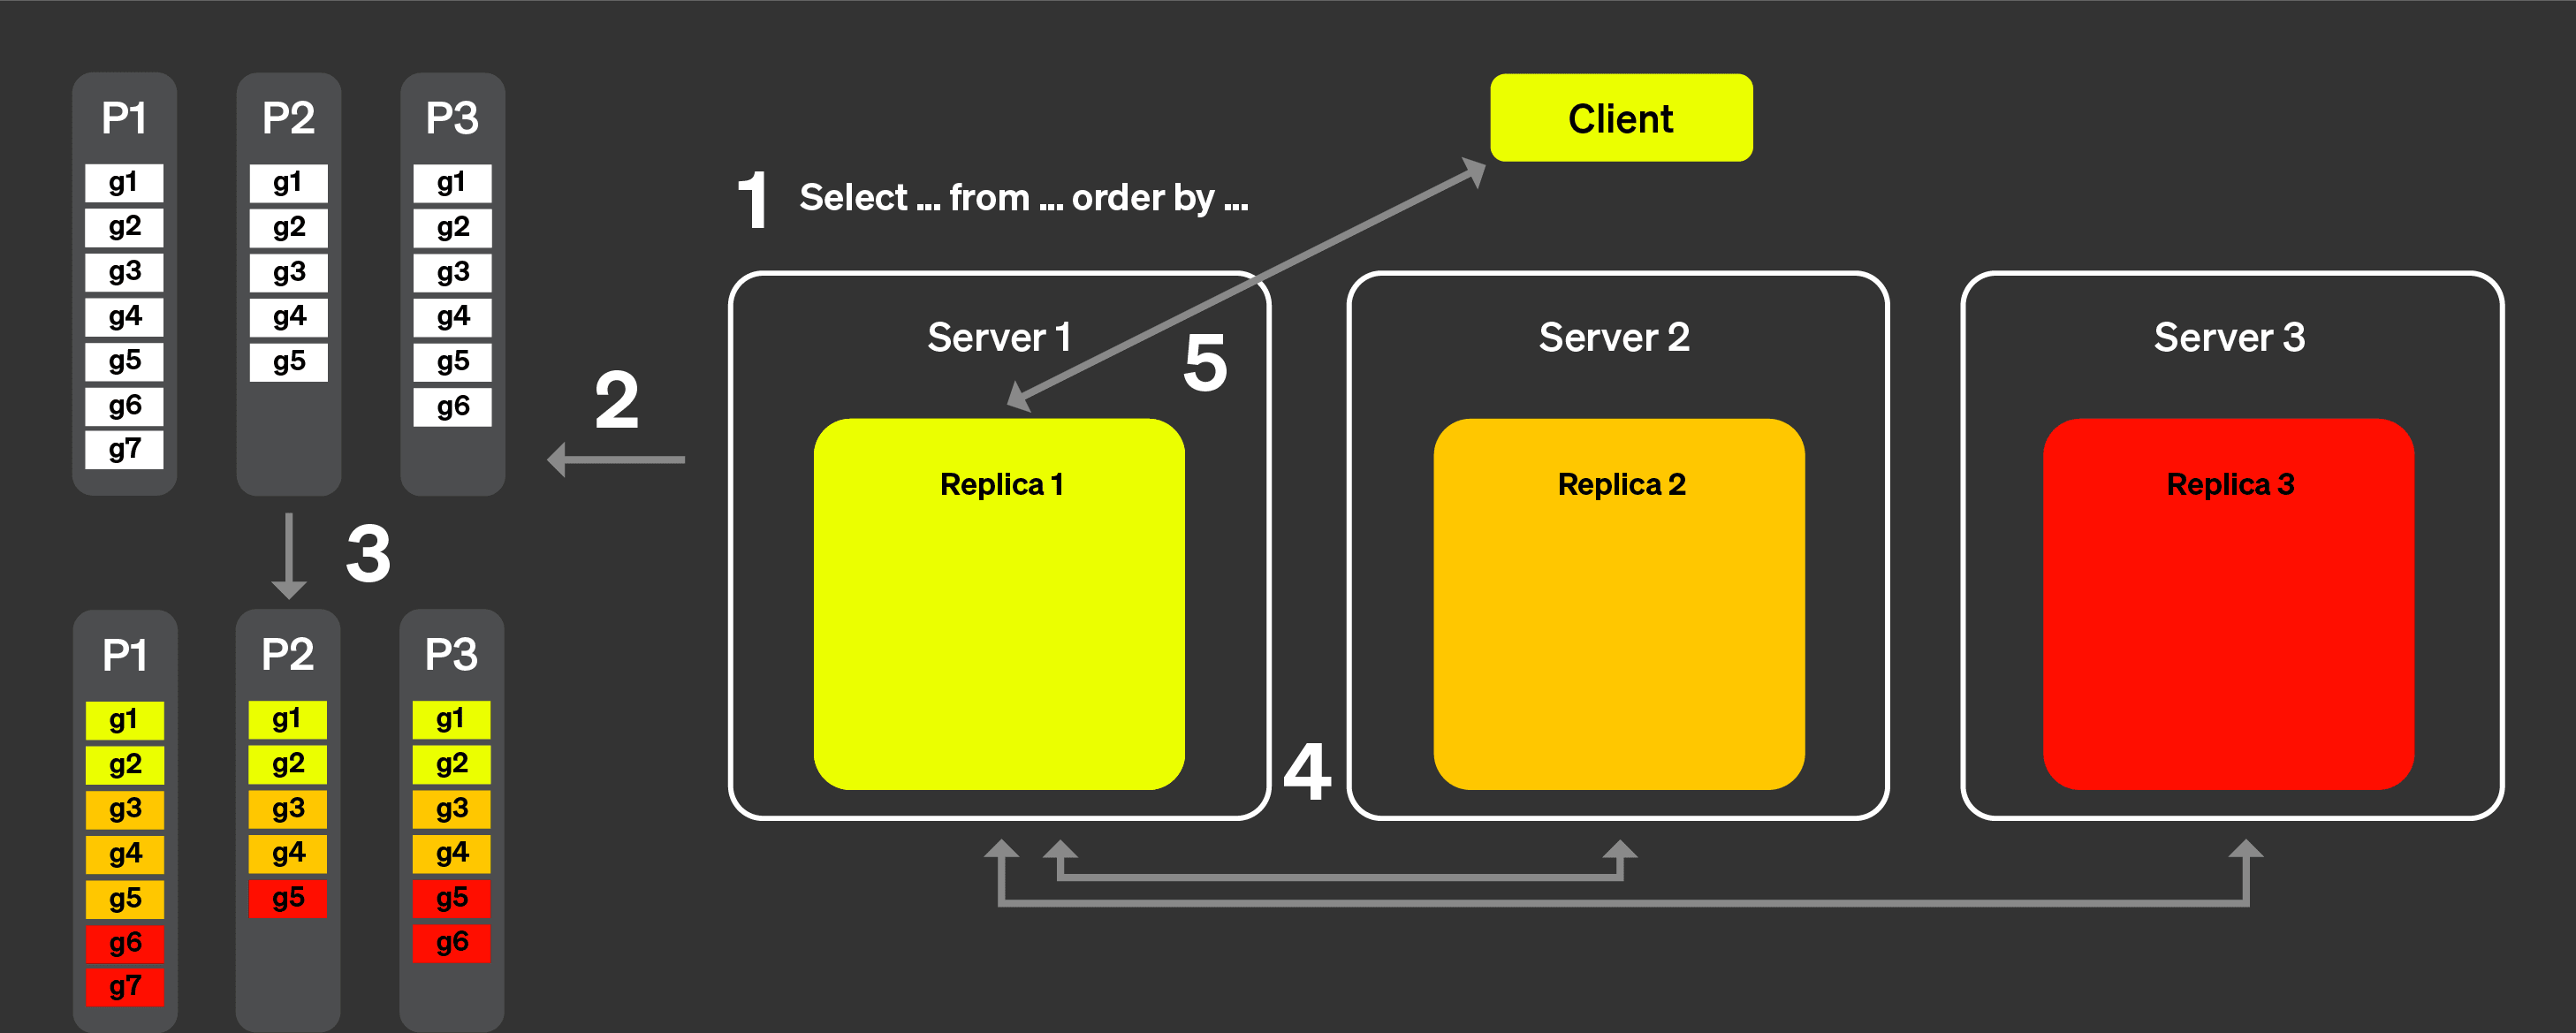
使用并行副本时:
客户端发出的查询先经过负载均衡器,然后被发送到某个节点。该节点将成为此次查询的协调器。
该节点会分析每个 分片 的索引,并选出需要处理的 分片 和粒度。
协调器会将工作负载拆分成一组可分配给不同副本的粒度。
每组粒度会由相应的副本处理,完成后会将可合并状态发送给协调器。
最后,协调器会合并来自各个副本的结果,然后将响应返回给客户端。
以上步骤概述了并行副本在理论上的工作方式。 然而在实际中,有很多因素可能导致这套逻辑无法完美运行:
某些副本可能不可用。
ClickHouse 中的复制是异步的,因此某些副本在某一时刻可能并不拥有相同的 分片。
需要以某种方式处理副本之间的长尾延迟。
文件系统缓存会因各个副本上的活动不同而有所差异,这意味着随机分配任务可能会因为缓存局部性而导致性能不够理想。
我们将在接下来的章节中说明如何克服这些因素。
通知
为了解决上述列表中的 (1) 和 (2),我们引入了“通知”这一概念。下面通过下图来说明其工作方式:
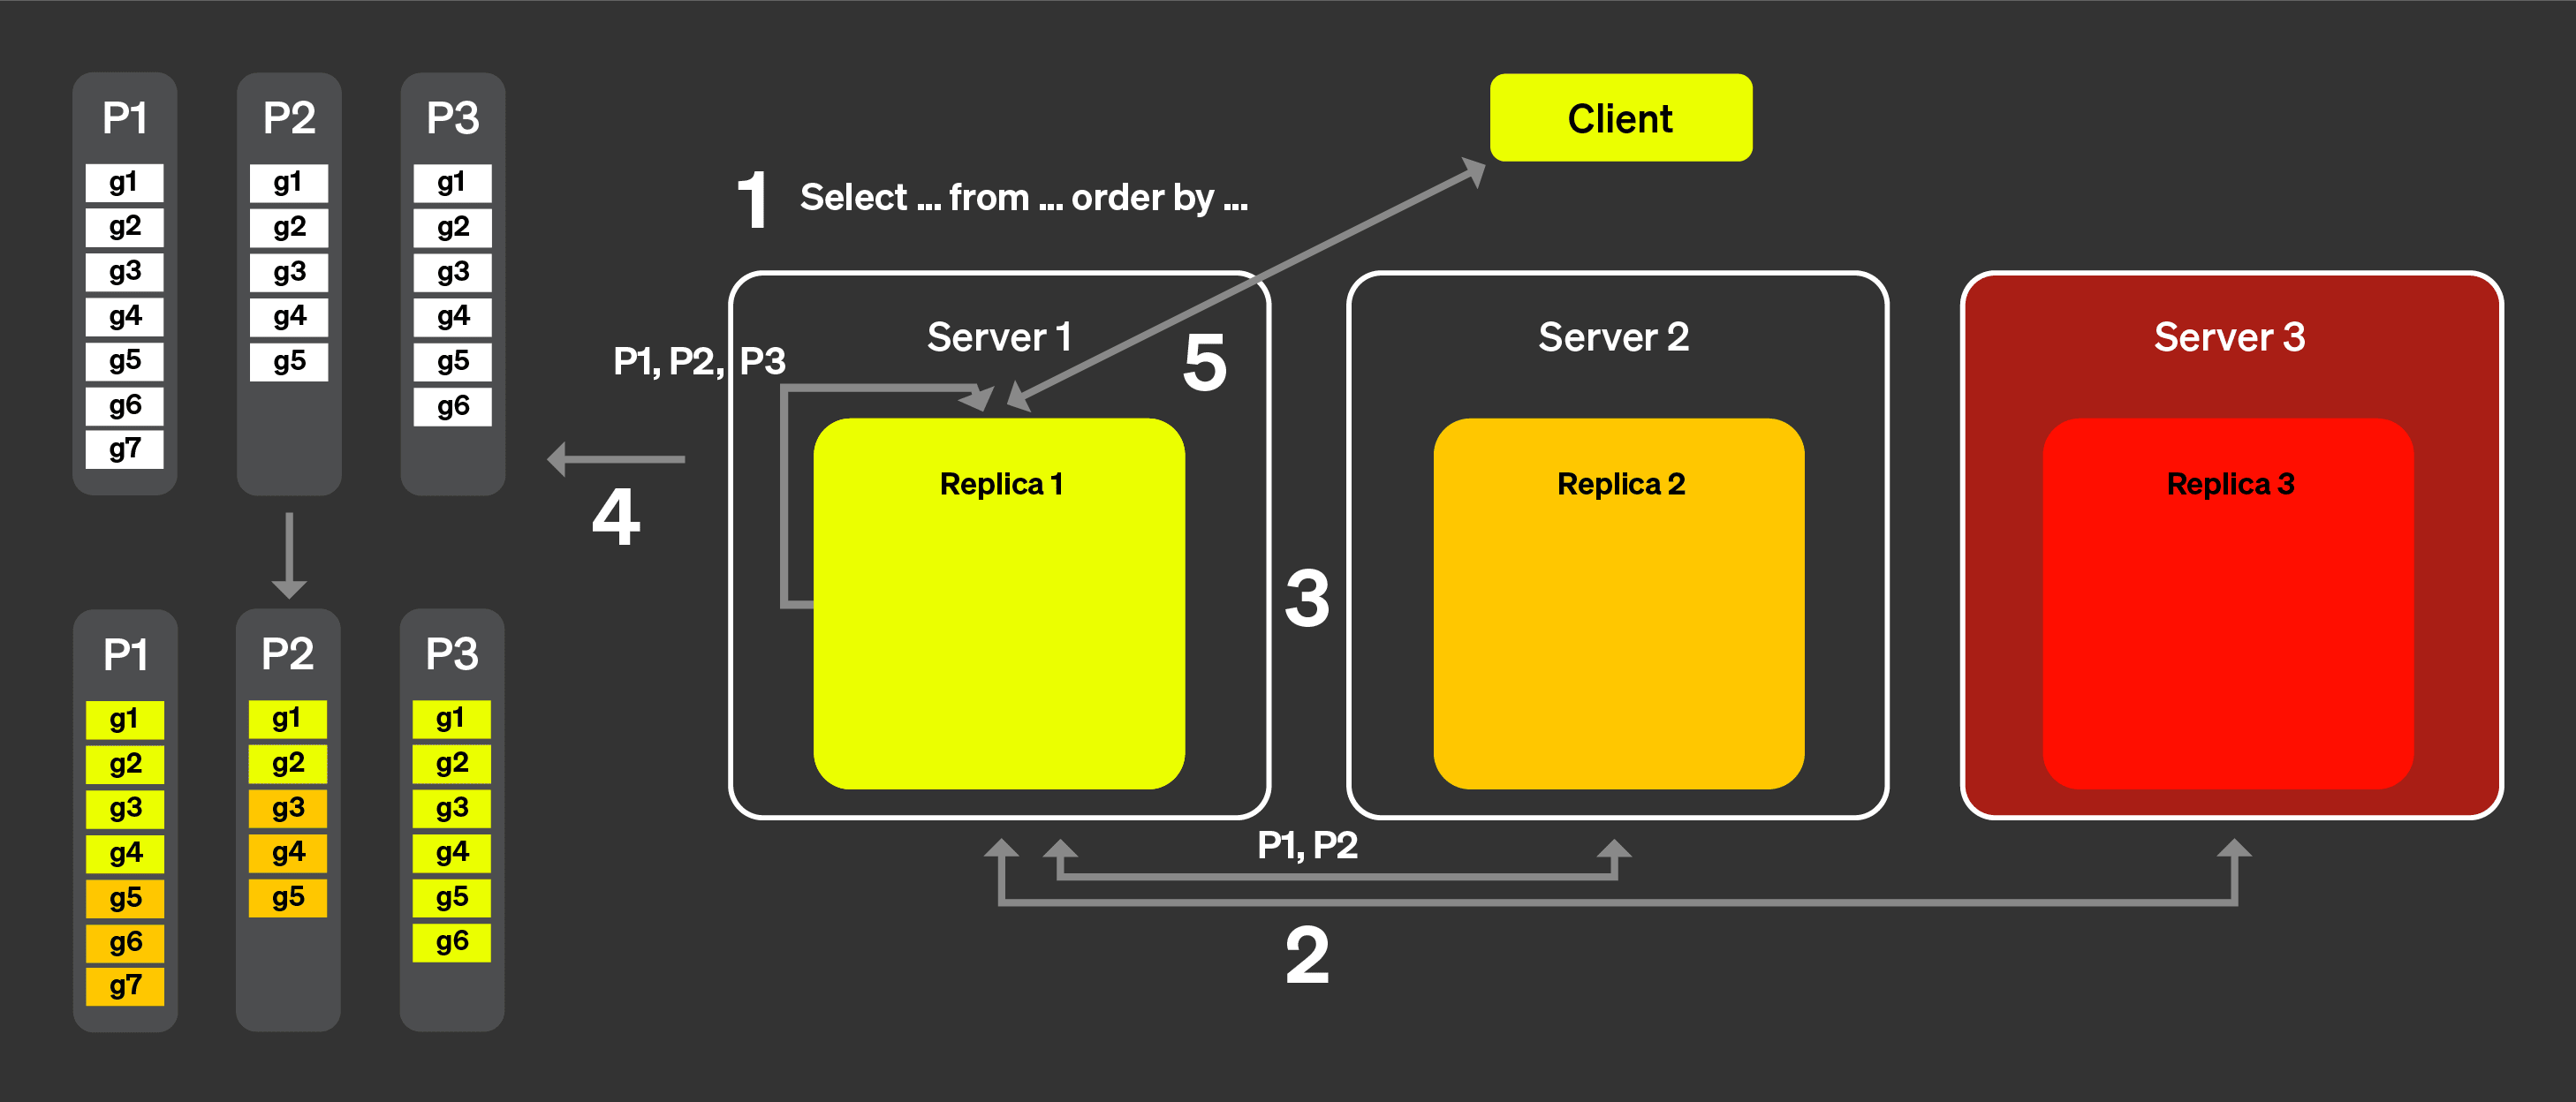
来自客户端的查询经过负载均衡器后,会被发送到某个节点。该节点将成为此次查询的协调器。
协调器会发送请求,以获取集群中所有副本的通知。 对于某个表当前的 分片 集合,不同副本看到的内容可能略有差异。因此,我们需要 收集这些信息,以避免做出错误的调度决策。
随后,协调器会利用这些通知确定一组 可分配给不同副本的粒度。以这里为例, 我们可以看到,分片 3 中的粒度没有分配给副本 2, 因为该副本在其通知中没有提供这个 分片。 还要注意的是,没有任务分配给副本 3,因为该 副本没有提供通知。
当每个副本都在各自负责的粒度子集上完成查询处理, 并将可合并状态发回协调器后, 协调器会合并结果,然后将响应发送给客户端。
动态协调
为了解决长尾延迟问题,我们引入了动态协调。这意味着, 不会在一次请求中将所有粒度都发送给某个副本,而是每个副本 都可以向协调器请求一个新任务 (一组待处理的粒度) 。 协调器会根据收到的通知,将相应的一组粒度分配给该副本。
假设当前流程已经进行到这样一个阶段:所有副本都已发送 包含所有 分片 的通知。
下图展示了动态协调的工作方式:
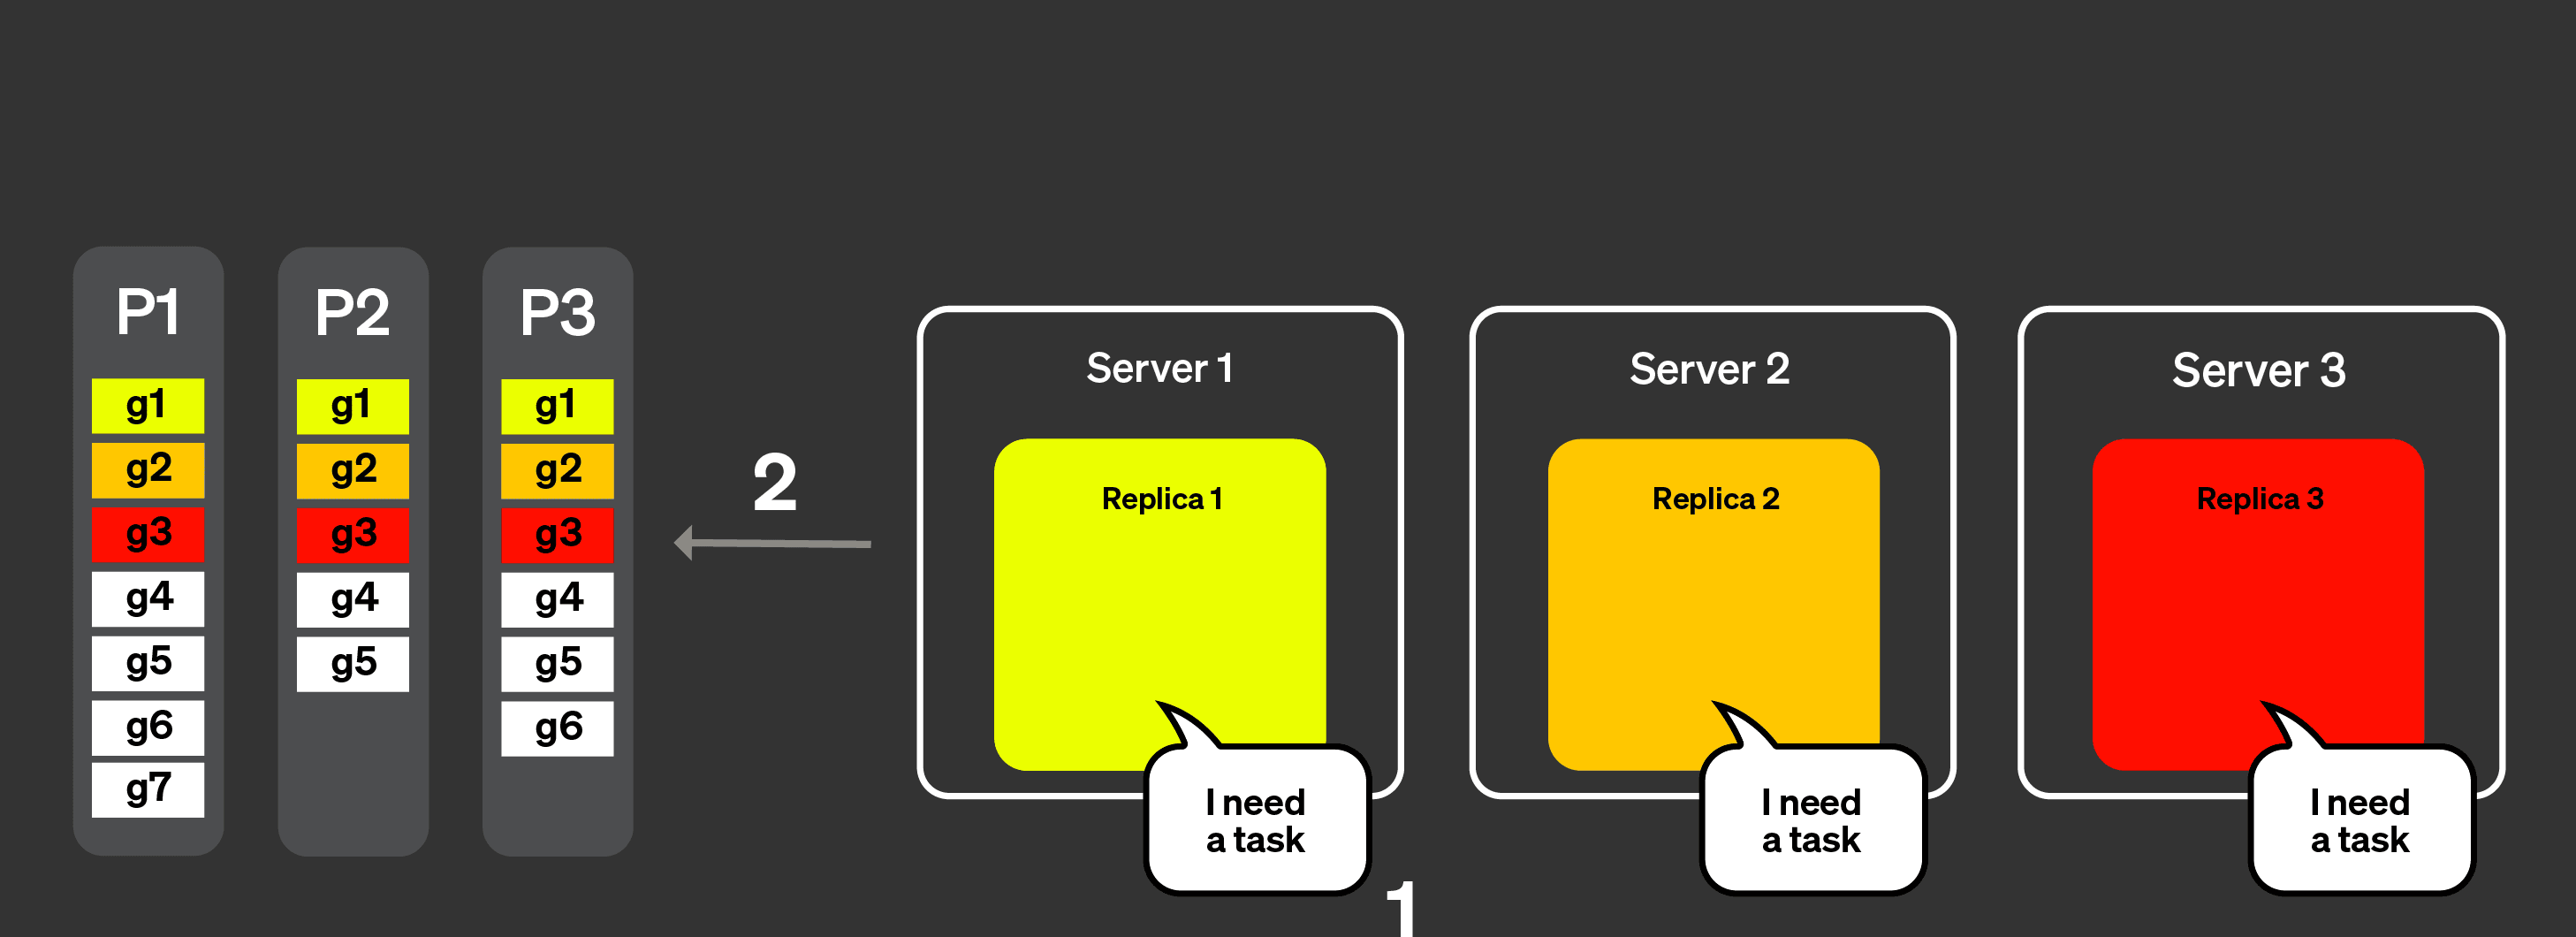
副本会告知协调器自己可以处理 任务,也可以说明自己能够处理多少工作量。
协调器将任务分配给各个副本。
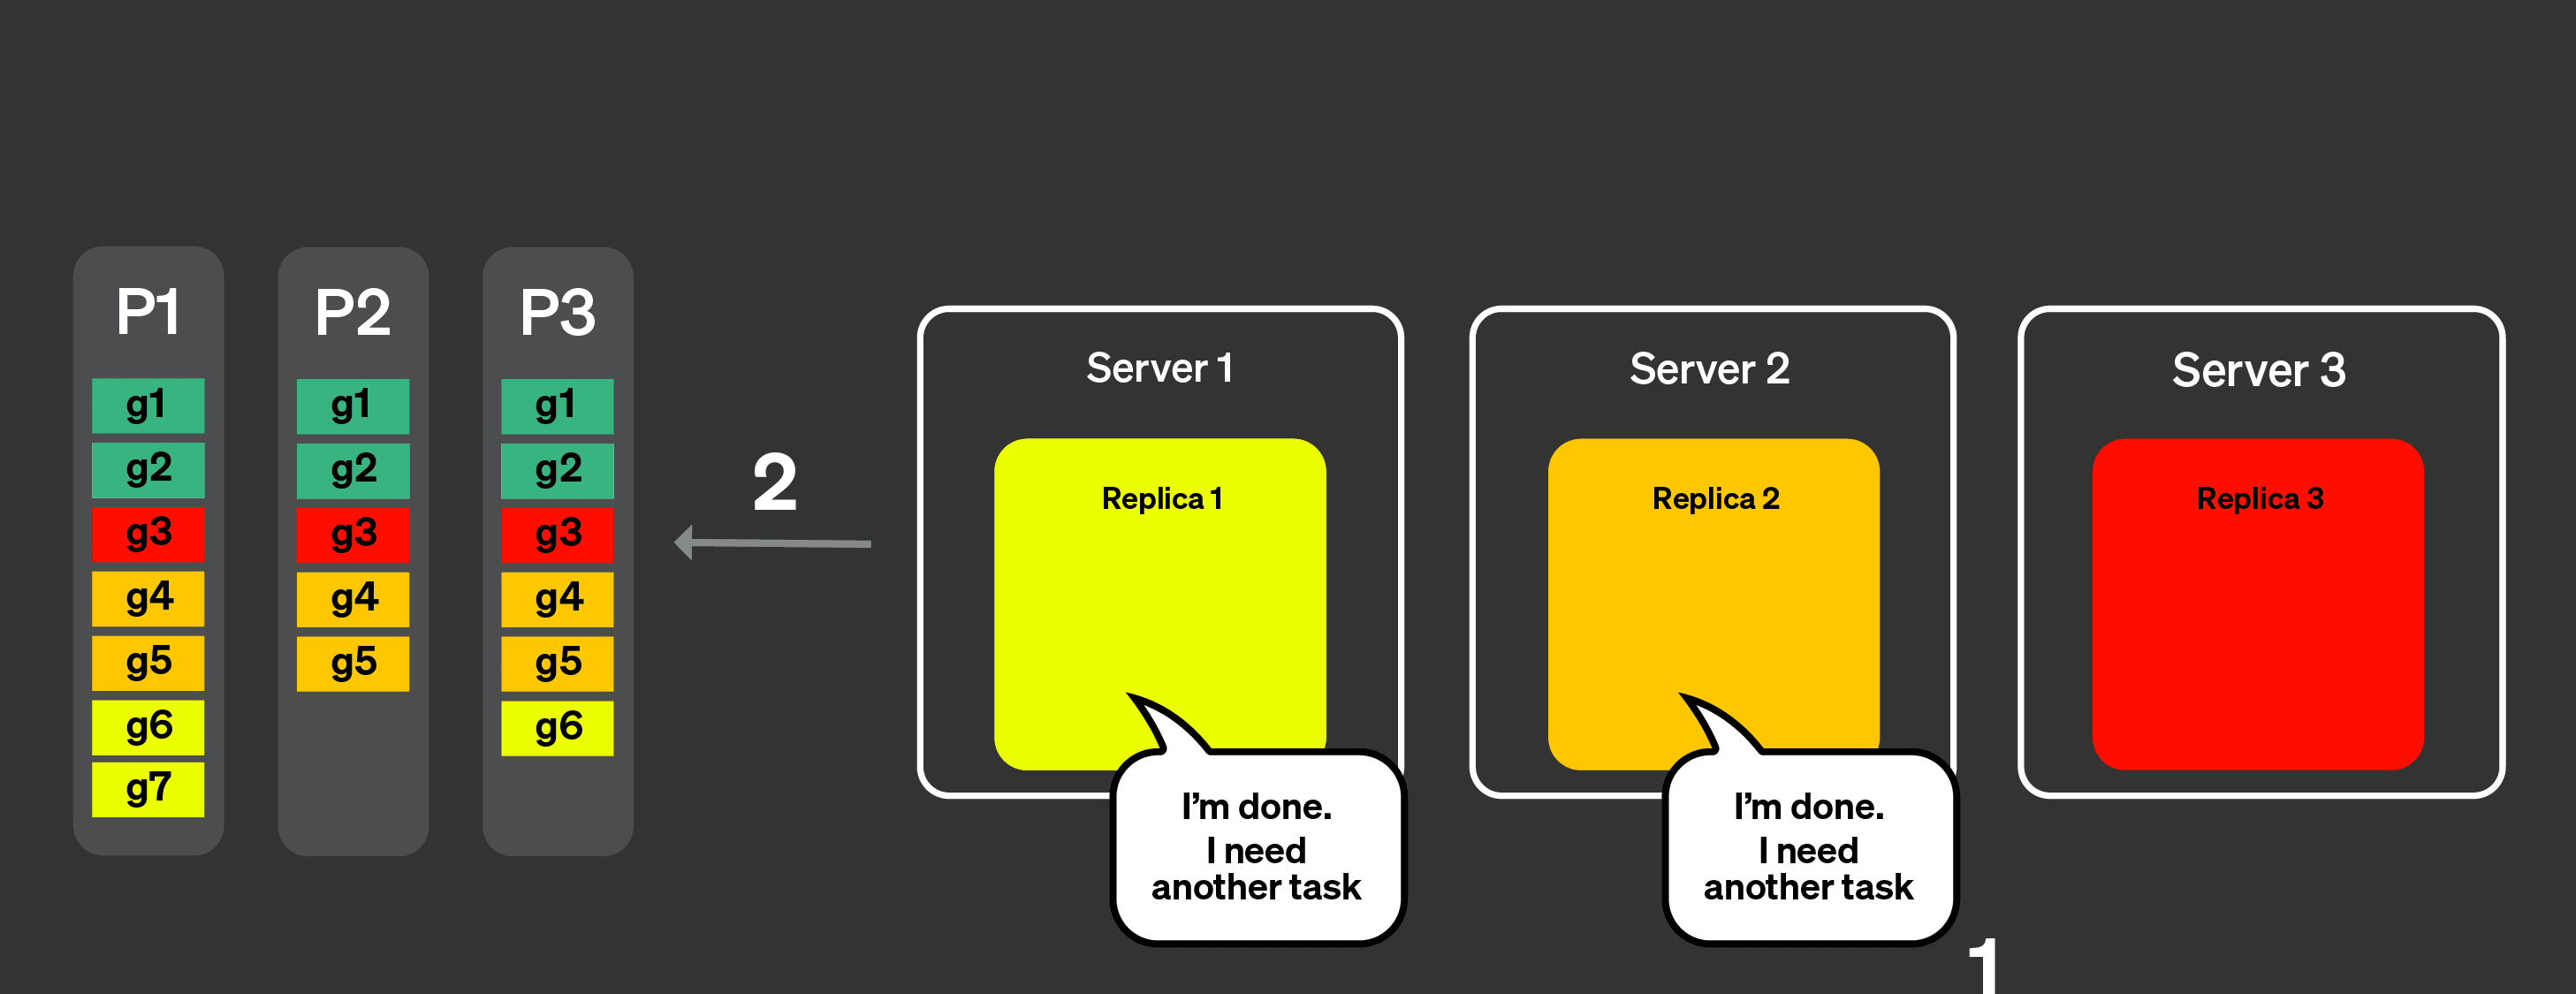
副本 1 和 2 很快就完成了各自的任务。它们 会向协调器请求另一个任务。
协调器将新任务分配给副本 1 和 2。
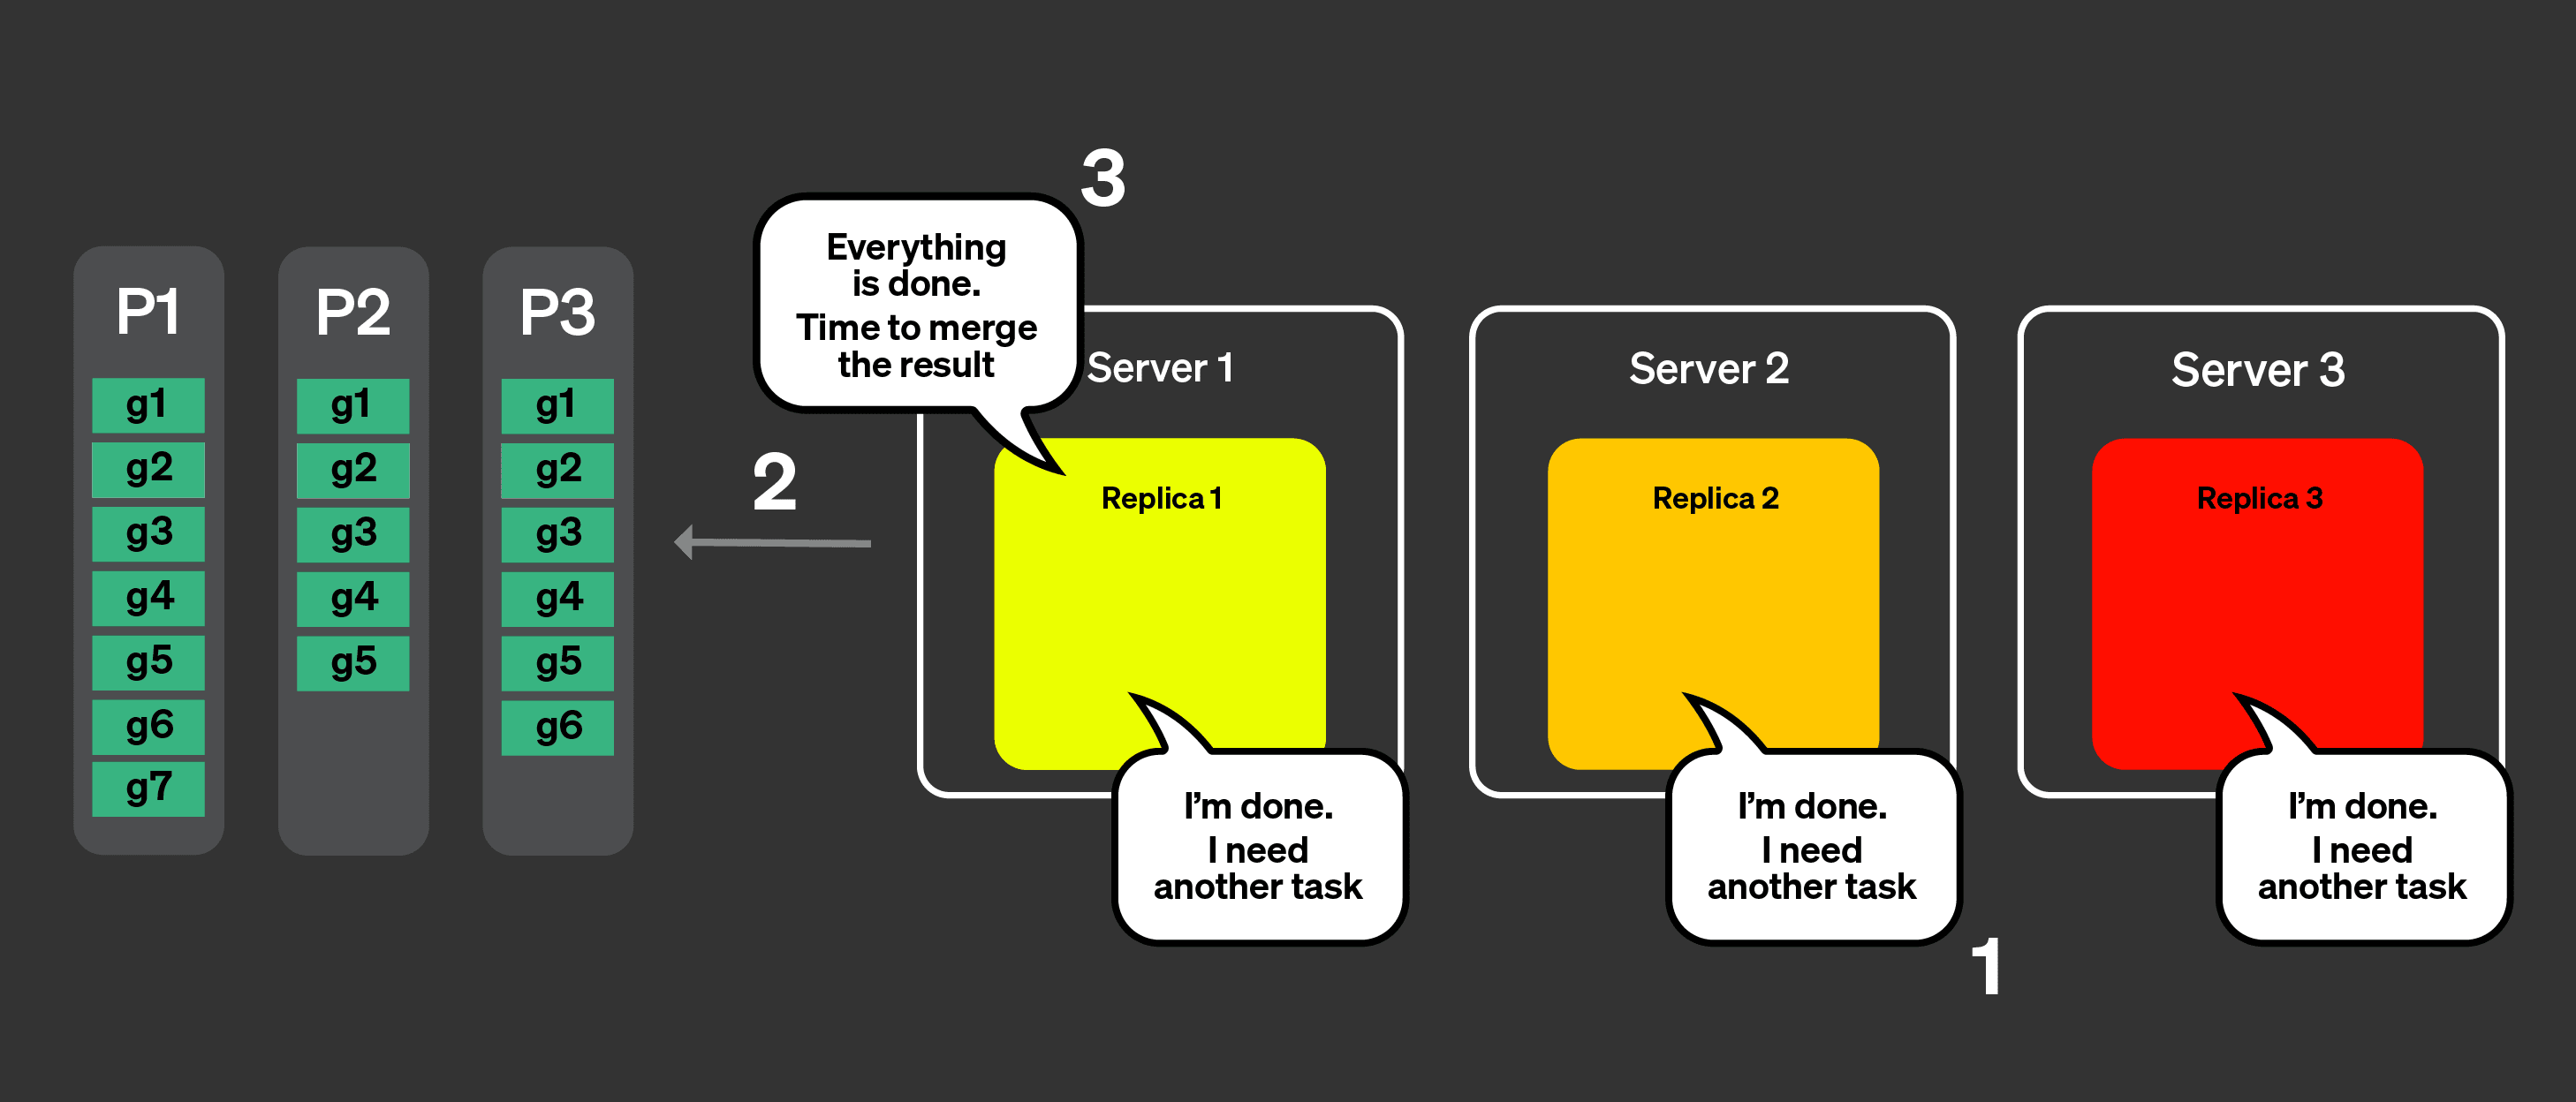
现在所有副本都已完成各自任务的处理。它们 会请求更多任务。
协调器利用这些通知检查还剩下哪些任务 需要处理,但此时已经没有剩余任务了。
协调器会通知各个副本,所有内容都已处理完成。 接下来,它会合并所有可合并状态,并返回查询结果。
管理缓存局部性
最后一个尚待解决的潜在问题是如何处理缓存局部性。如果同一个查询 会执行多次,如何确保同一个任务总是被路由到同一个 副本?在前面的示例中,任务分配如下:
| 副本 1 | 副本 2 | 副本 3 | |
|---|---|---|---|
| 分片 1 | g1, g6, g7 | g2, g4, g5 | g3 |
| 分片 2 | g1 | g2, g4, g5 | g3 |
| 分片 3 | g1, g6 | g2, g4, g5 | g3 |
为了确保相同的任务会分配到相同的副本上,从而受益于缓存, 这里会进行两步处理。首先,计算分片 + 粒度集合 (即一个任务) 的哈希值;然后,在任务分配时 按副本数量取模。
理论上这听起来不错,但在实际中,如果某个副本突发负载升高,或者
网络状况恶化,而某些任务又始终固定由同一个副本
执行,就可能引入尾延迟。如果 max_parallel_replicas 小于
副本数量,则会随机选择副本来执行查询。
任务窃取
如果某个副本处理任务的速度比其他副本慢,其他副本会尝试 “窃取”按哈希原本应分配给该副本的任务,以降低 长尾延迟。
限制
此功能存在一些已知限制,其中较为主要的限制记录在 本节中。
| 限制 | 描述 |
|---|---|
| 复杂查询 | 目前,并行副本对简单查询的支持效果较好。像 CTE、子查询、JOIN、非扁平查询等较复杂的查询层次结构,可能会对查询性能产生负面影响。 |
| 小型查询 | 如果你执行的查询处理的行数不多,那么在多个副本上执行它未必会带来更好的性能,因为副本之间协调所需的网络开销可能会为查询执行增加额外轮次。你可以使用以下设置来减少这些问题:parallel_replicas_min_number_of_rows_per_replica。 |
| 启用 FINAL 时会禁用并行副本 | |
| 投影不会与并行副本一同使用 | |
| 高基数数据和复杂聚合 | 需要传输大量数据的高基数聚合可能会显著拖慢查询。 |
| 与 analyzer 的兼容性 | analyzer 在某些场景下可能会显著减慢或加快查询执行速度。 |
| Setting | Description |
|---|---|
enable_parallel_replicas |
0:禁用1:启用 2:强制使用并行副本,如未使用则抛出异常。 |
cluster_for_parallel_replicas |
用于并行副本的集群名称;如果你使用的是 ClickHouse Cloud,请使用 default。 |
max_parallel_replicas |
在多个副本上执行查询时可使用的最大副本数;如果指定的数值小于集群中的副本数,则会随机选择节点。该值也可以 overcommit,以适应横向扩缩容。 |
parallel_replicas_min_number_of_rows_per_replica |
有助于根据需要处理的行数限制所使用的副本数,使用的副本数由以下公式确定:estimated rows to read / min_number_of_rows_per_replica。 |
enable_analyzer |
仅在启用 analyzer 时,才支持使用并行副本执行查询 |
排查并行副本问题
你可以在
system.query_log 表中查看每个查询使用了哪些设置。你还可以查看 system.events
表,了解 服务器 上发生的所有事件;也可以使用
clusterAllReplicas 表函数查看所有副本上的表
(如果你是 Cloud 用户,请使用 default) 。
SELECT
   hostname(),
   *
FROM clusterAllReplicas('default', system.events)
WHERE event ILIKE '%ParallelReplicas%'
响应
┌─hostname()───────────────────────┬─event──────────────────────────────────────────┬─value─┬─description──────────────────────────────────────────────────────────────────────────────────────────┐
│ c-crimson-vd-86-server-rdhnsx3-0 │ ParallelReplicasHandleRequestMicroseconds      │   438 │ Time spent processing requests for marks from replicas                                               │
│ c-crimson-vd-86-server-rdhnsx3-0 │ ParallelReplicasHandleAnnouncementMicroseconds │   558 │ Time spent processing replicas announcements                                                         │
│ c-crimson-vd-86-server-rdhnsx3-0 │ ParallelReplicasReadUnassignedMarks            │   240 │ Sum across all replicas of how many unassigned marks were scheduled                                  │
│ c-crimson-vd-86-server-rdhnsx3-0 │ ParallelReplicasReadAssignedForStealingMarks   │     4 │ Sum across all replicas of how many of scheduled marks were assigned for stealing by consistent hash │
│ c-crimson-vd-86-server-rdhnsx3-0 │ ParallelReplicasStealingByHashMicroseconds     │     5 │ Time spent collecting segments meant for stealing by hash                                            │
│ c-crimson-vd-86-server-rdhnsx3-0 │ ParallelReplicasProcessingPartsMicroseconds    │     5 │ Time spent processing data parts                                                                     │
│ c-crimson-vd-86-server-rdhnsx3-0 │ ParallelReplicasStealingLeftoversMicroseconds  │     3 │ Time spent collecting orphaned segments                                                              │
│ c-crimson-vd-86-server-rdhnsx3-0 │ ParallelReplicasUsedCount                      │     2 │ Number of replicas used to execute a query with task-based parallel replicas                         │
│ c-crimson-vd-86-server-rdhnsx3-0 │ ParallelReplicasAvailableCount                 │     6 │ Number of replicas available to execute a query with task-based parallel replicas                    │
└──────────────────────────────────┴────────────────────────────────────────────────┴───────┴──────────────────────────────────────────────────────────────────────────────────────────────────────┘
┌─hostname()───────────────────────┬─event──────────────────────────────────────────┬─value─┬─description──────────────────────────────────────────────────────────────────────────────────────────┐
│ c-crimson-vd-86-server-e9kp5f0-0 │ ParallelReplicasHandleRequestMicroseconds      │   698 │ Time spent processing requests for marks from replicas                                               │
│ c-crimson-vd-86-server-e9kp5f0-0 │ ParallelReplicasHandleAnnouncementMicroseconds │   644 │ Time spent processing replicas announcements                                                         │
│ c-crimson-vd-86-server-e9kp5f0-0 │ ParallelReplicasReadUnassignedMarks            │   190 │ Sum across all replicas of how many unassigned marks were scheduled                                  │
│ c-crimson-vd-86-server-e9kp5f0-0 │ ParallelReplicasReadAssignedForStealingMarks   │    54 │ Sum across all replicas of how many of scheduled marks were assigned for stealing by consistent hash │
│ c-crimson-vd-86-server-e9kp5f0-0 │ ParallelReplicasStealingByHashMicroseconds     │     8 │ Time spent collecting segments meant for stealing by hash                                            │
│ c-crimson-vd-86-server-e9kp5f0-0 │ ParallelReplicasProcessingPartsMicroseconds    │     4 │ Time spent processing data parts                                                                     │
│ c-crimson-vd-86-server-e9kp5f0-0 │ ParallelReplicasStealingLeftoversMicroseconds  │     2 │ Time spent collecting orphaned segments                                                              │
│ c-crimson-vd-86-server-e9kp5f0-0 │ ParallelReplicasUsedCount                      │     2 │ Number of replicas used to execute a query with task-based parallel replicas                         │
│ c-crimson-vd-86-server-e9kp5f0-0 │ ParallelReplicasAvailableCount                 │     6 │ Number of replicas available to execute a query with task-based parallel replicas                    │
└──────────────────────────────────┴────────────────────────────────────────────────┴───────┴──────────────────────────────────────────────────────────────────────────────────────────────────────┘
┌─hostname()───────────────────────┬─event──────────────────────────────────────────┬─value─┬─description──────────────────────────────────────────────────────────────────────────────────────────┐
│ c-crimson-vd-86-server-ybtm18n-0 │ ParallelReplicasHandleRequestMicroseconds      │   620 │ Time spent processing requests for marks from replicas                                               │
│ c-crimson-vd-86-server-ybtm18n-0 │ ParallelReplicasHandleAnnouncementMicroseconds │   656 │ Time spent processing replicas announcements                                                         │
│ c-crimson-vd-86-server-ybtm18n-0 │ ParallelReplicasReadUnassignedMarks            │     1 │ Sum across all replicas of how many unassigned marks were scheduled                                  │
│ c-crimson-vd-86-server-ybtm18n-0 │ ParallelReplicasReadAssignedForStealingMarks   │     1 │ Sum across all replicas of how many of scheduled marks were assigned for stealing by consistent hash │
│ c-crimson-vd-86-server-ybtm18n-0 │ ParallelReplicasStealingByHashMicroseconds     │     4 │ Time spent collecting segments meant for stealing by hash                                            │
│ c-crimson-vd-86-server-ybtm18n-0 │ ParallelReplicasProcessingPartsMicroseconds    │     3 │ Time spent processing data parts                                                                     │
│ c-crimson-vd-86-server-ybtm18n-0 │ ParallelReplicasStealingLeftoversMicroseconds  │     1 │ Time spent collecting orphaned segments                                                              │
│ c-crimson-vd-86-server-ybtm18n-0 │ ParallelReplicasUsedCount                      │     2 │ Number of replicas used to execute a query with task-based parallel replicas                         │
│ c-crimson-vd-86-server-ybtm18n-0 │ ParallelReplicasAvailableCount                 │    12 │ Number of replicas available to execute a query with task-based parallel replicas                    │
└──────────────────────────────────┴────────────────────────────────────────────────┴───────┴──────────────────────────────────────────────────────────────────────────────────────────────────────┘
┌─hostname()───────────────────────┬─event──────────────────────────────────────────┬─value─┬─description──────────────────────────────────────────────────────────────────────────────────────────┐
│ c-crimson-vd-86-server-16j1ncj-0 │ ParallelReplicasHandleRequestMicroseconds      │   696 │ Time spent processing requests for marks from replicas                                               │
│ c-crimson-vd-86-server-16j1ncj-0 │ ParallelReplicasHandleAnnouncementMicroseconds │   717 │ Time spent processing replicas announcements                                                         │
│ c-crimson-vd-86-server-16j1ncj-0 │ ParallelReplicasReadUnassignedMarks            │     2 │ Sum across all replicas of how many unassigned marks were scheduled                                  │
│ c-crimson-vd-86-server-16j1ncj-0 │ ParallelReplicasReadAssignedForStealingMarks   │     2 │ Sum across all replicas of how many of scheduled marks were assigned for stealing by consistent hash │
│ c-crimson-vd-86-server-16j1ncj-0 │ ParallelReplicasStealingByHashMicroseconds     │    10 │ Time spent collecting segments meant for stealing by hash                                            │
│ c-crimson-vd-86-server-16j1ncj-0 │ ParallelReplicasProcessingPartsMicroseconds    │     6 │ Time spent processing data parts                                                                     │
│ c-crimson-vd-86-server-16j1ncj-0 │ ParallelReplicasStealingLeftoversMicroseconds  │     2 │ Time spent collecting orphaned segments                                                              │
│ c-crimson-vd-86-server-16j1ncj-0 │ ParallelReplicasUsedCount                      │     2 │ Number of replicas used to execute a query with task-based parallel replicas                         │
│ c-crimson-vd-86-server-16j1ncj-0 │ ParallelReplicasAvailableCount                 │    12 │ Number of replicas available to execute a query with task-based parallel replicas                    │
└──────────────────────────────────┴────────────────────────────────────────────────┴───────┴──────────────────────────────────────────────────────────────────────────────────────────────────────┘
system.text_log 表还
包含使用并行副本执行查询时的相关信息:
SELECT message
FROM clusterAllReplicas('default', system.text_log)
WHERE query_id = 'ad40c712-d25d-45c4-b1a1-a28ba8d4019c'
ORDER BY event_time_microseconds ASC
响应
┌─message────────────────────────────────────────────────────────────────────────────────────────────────────────────────────────────────────────────────────────────────────────────────────────────────────────────────────────────────────────────────────┐
│ (from 54.218.178.249:59198) SELECT * FROM session_events WHERE type='type2' LIMIT 10 SETTINGS allow_experimental_parallel_reading_from_replicas=2; (stage: Complete) │
│ Query SELECT __table1.clientId AS clientId, __table1.sessionId AS sessionId, __table1.pageId AS pageId, __table1.timestamp AS timestamp, __table1.type AS type FROM default.session_events AS __table1 WHERE __table1.type = 'type2' LIMIT _CAST(10, 'UInt64') SETTINGS allow_experimental_parallel_reading_from_replicas = 2 to stage Complete │
│ Access granted: SELECT(clientId, sessionId, pageId, timestamp, type) ON default.session_events │
│ Query SELECT __table1.clientId AS clientId, __table1.sessionId AS sessionId, __table1.pageId AS pageId, __table1.timestamp AS timestamp, __table1.type AS type FROM default.session_events AS __table1 WHERE __table1.type = 'type2' LIMIT _CAST(10, 'UInt64') to stage WithMergeableState only analyze │
│ Access granted: SELECT(clientId, sessionId, pageId, timestamp, type) ON default.session_events │
│ Query SELECT __table1.clientId AS clientId, __table1.sessionId AS sessionId, __table1.pageId AS pageId, __table1.timestamp AS timestamp, __table1.type AS type FROM default.session_events AS __table1 WHERE __table1.type = 'type2' LIMIT _CAST(10, 'UInt64') from stage FetchColumns to stage WithMergeableState only analyze │
│ Query SELECT __table1.clientId AS clientId, __table1.sessionId AS sessionId, __table1.pageId AS pageId, __table1.timestamp AS timestamp, __table1.type AS type FROM default.session_events AS __table1 WHERE __table1.type = 'type2' LIMIT _CAST(10, 'UInt64') SETTINGS allow_experimental_parallel_reading_from_replicas = 2 to stage WithMergeableState only analyze │
│ Access granted: SELECT(clientId, sessionId, pageId, timestamp, type) ON default.session_events │
│ Query SELECT __table1.clientId AS clientId, __table1.sessionId AS sessionId, __table1.pageId AS pageId, __table1.timestamp AS timestamp, __table1.type AS type FROM default.session_events AS __table1 WHERE __table1.type = 'type2' LIMIT _CAST(10, 'UInt64') SETTINGS allow_experimental_parallel_reading_from_replicas = 2 from stage FetchColumns to stage WithMergeableState only analyze │
│ Query SELECT __table1.clientId AS clientId, __table1.sessionId AS sessionId, __table1.pageId AS pageId, __table1.timestamp AS timestamp, __table1.type AS type FROM default.session_events AS __table1 WHERE __table1.type = 'type2' LIMIT _CAST(10, 'UInt64') SETTINGS allow_experimental_parallel_reading_from_replicas = 2 from stage WithMergeableState to stage Complete │
│ The number of replicas requested (100) is bigger than the real number available in the cluster (6). Will use the latter number to execute the query. │
│ Initial request from replica 4: 2 parts: [part all_0_2_1 with ranges [(0, 182)], part all_3_3_0 with ranges [(0, 62)]]----------
Received from 4 replica
│
│ Reading state is fully initialized: part all_0_2_1 with ranges [(0, 182)] in replicas [4]; part all_3_3_0 with ranges [(0, 62)] in replicas [4] │
│ Sent initial requests: 1 Replicas count: 6 │
│ Initial request from replica 2: 2 parts: [part all_0_2_1 with ranges [(0, 182)], part all_3_3_0 with ranges [(0, 62)]]----------
Received from 2 replica
│
│ Sent initial requests: 2 Replicas count: 6 │
│ Handling request from replica 4, minimal marks size is 240 │
│ Going to respond to replica 4 with 1 parts: [part all_0_2_1 with ranges [(128, 182)]]. Finish: false; mine_marks=0, stolen_by_hash=54, stolen_rest=0 │
│ Initial request from replica 1: 2 parts: [part all_0_2_1 with ranges [(0, 182)], part all_3_3_0 with ranges [(0, 62)]]----------
Received from 1 replica
│
│ Sent initial requests: 3 Replicas count: 6 │
│ Handling request from replica 4, minimal marks size is 240 │
│ Going to respond to replica 4 with 2 parts: [part all_0_2_1 with ranges [(0, 128)], part all_3_3_0 with ranges [(0, 62)]]. Finish: false; mine_marks=0, stolen_by_hash=0, stolen_rest=190 │
│ Initial request from replica 0: 2 parts: [part all_0_2_1 with ranges [(0, 182)], part all_3_3_0 with ranges [(0, 62)]]----------
Received from 0 replica
│
│ Sent initial requests: 4 Replicas count: 6 │
│ Initial request from replica 5: 2 parts: [part all_0_2_1 with ranges [(0, 182)], part all_3_3_0 with ranges [(0, 62)]]----------
Received from 5 replica
│
│ Sent initial requests: 5 Replicas count: 6 │
│ Handling request from replica 2, minimal marks size is 240 │
│ Going to respond to replica 2 with 0 parts: []. Finish: true; mine_marks=0, stolen_by_hash=0, stolen_rest=0 │
│ Initial request from replica 3: 2 parts: [part all_0_2_1 with ranges [(0, 182)], part all_3_3_0 with ranges [(0, 62)]]----------
Received from 3 replica
│
│ Sent initial requests: 6 Replicas count: 6 │
│ Total rows to read: 2000000 │
│ Handling request from replica 5, minimal marks size is 240 │
│ Going to respond to replica 5 with 0 parts: []. Finish: true; mine_marks=0, stolen_by_hash=0, stolen_rest=0 │
│ Handling request from replica 0, minimal marks size is 240 │
│ Going to respond to replica 0 with 0 parts: []. Finish: true; mine_marks=0, stolen_by_hash=0, stolen_rest=0 │
│ Handling request from replica 1, minimal marks size is 240 │
│ Going to respond to replica 1 with 0 parts: []. Finish: true; mine_marks=0, stolen_by_hash=0, stolen_rest=0 │
│ Handling request from replica 3, minimal marks size is 240 │
│ Going to respond to replica 3 with 0 parts: []. Finish: true; mine_marks=0, stolen_by_hash=0, stolen_rest=0 │
│ (c-crimson-vd-86-server-rdhnsx3-0.c-crimson-vd-86-server-headless.ns-crimson-vd-86.svc.cluster.local:9000) Cancelling query because enough data has been read │
│ Read 81920 rows, 5.16 MiB in 0.013166 sec., 6222087.194288318 rows/sec., 391.63 MiB/sec. │
│ Coordination done: Statistics: replica 0 - {requests: 2 marks: 0 assigned_to_me: 0 stolen_by_hash: 0 stolen_unassigned: 0}; replica 1 - {requests: 2 marks: 0 assigned_to_me: 0 stolen_by_hash: 0 stolen_unassigned: 0}; replica 2 - {requests: 2 marks: 0 assigned_to_me: 0 stolen_by_hash: 0 stolen_unassigned: 0}; replica 3 - {requests: 2 marks: 0 assigned_to_me: 0 stolen_by_hash: 0 stolen_unassigned: 0}; replica 4 - {requests: 3 marks: 244 assigned_to_me: 0 stolen_by_hash: 54 stolen_unassigned: 190}; replica 5 - {requests: 2 marks: 0 assigned_to_me: 0 stolen_by_hash: 0 stolen_unassigned: 0} │
│ Peak memory usage (for query): 1.81 MiB. │
│ Processed in 0.024095586 sec. │
└────────────────────────────────────────────────────────────────────────────────────────────────────────────────────────────────────────────────────────────────────────────────────────────────────────────────────────────────────────────────────────────┘最后,你还可以使用 EXPLAIN PIPELINE。它可以清晰地展示 ClickHouse
将如何执行查询,以及在执行该
查询时会用到哪些资源。以下面的查询为例:
SELECT count(), uniq(pageId) , min(timestamp), max(timestamp)
FROM session_events
WHERE type='type3'
GROUP BY toYear(timestamp) LIMIT 10
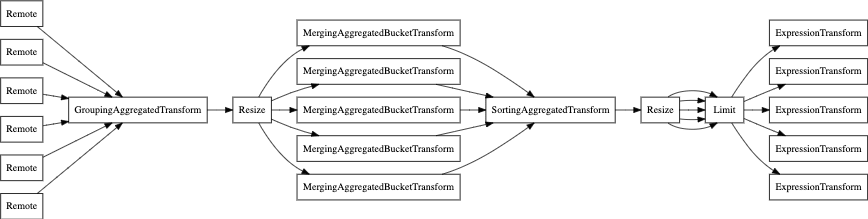
我们来看一下未使用并行副本时的查询管道:
EXPLAIN PIPELINE graph = 1, compact = 0
SELECT count(), uniq(pageId) , min(timestamp), max(timestamp)
FROM session_events
WHERE type='type3'
GROUP BY toYear(timestamp)
LIMIT 10
SETTINGS allow_experimental_parallel_reading_from_replicas=0
FORMAT TSV;
现在再看启用并行副本的情况:
EXPLAIN PIPELINE graph = 1, compact = 0
SELECT count(), uniq(pageId) , min(timestamp), max(timestamp)
FROM session_events
WHERE type='type3'
GROUP BY toYear(timestamp)
LIMIT 10
SETTINGS allow_experimental_parallel_reading_from_replicas=2
FORMAT TSV;