

 Set up docs MCP
修改配置最简单的方式,是在 Grafana UI 的插件配置页面中进行,但也可以通过 YAML 文件预配数据源。
本页列出了 ClickHouse 插件中可配置的各项选项,以及通过 YAML 预配数据源时可用的配置片段。
如需快速了解所有选项,请在此处查看完整的配置选项列表。
通用设置
示例配置界面:
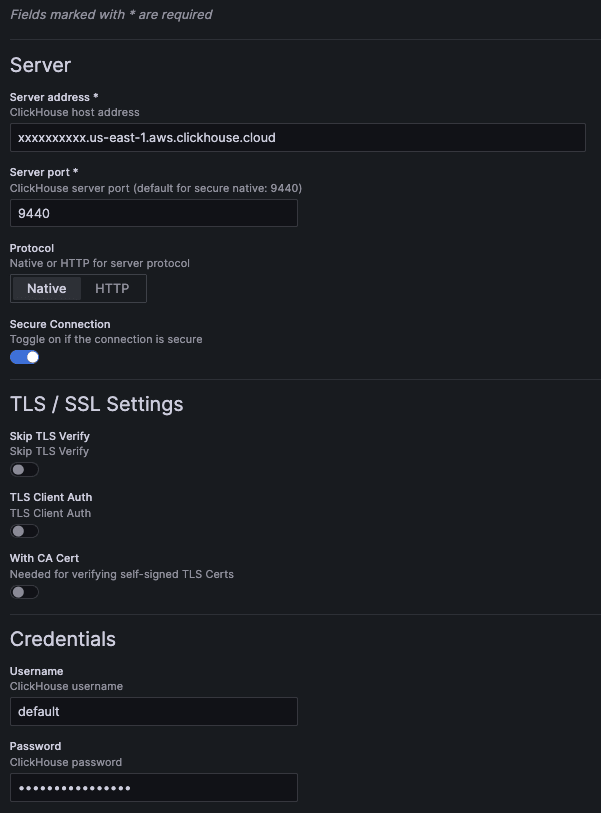
通用设置的 YAML 配置示例:
jsonData:
  host: 127.0.0.1 # (required) server address.
  port: 9000      # (required) server port. For native, defaults to 9440 secure and 9000 insecure. For HTTP, defaults to 8443 secure and 8123 insecure.

  protocol: native # (required) the protocol used for the connection. Can be set to "native" or "http".
  secure: false    # set to true if the connection is secure.

  username: default # the username used for authentication.

  tlsSkipVerify:     <boolean> # skips TLS verification when set to true.
  tlsAuth:           <boolean> # set to true to enable TLS client authentication.
  tlsAuthWithCACert: <boolean> # set to true if CA certificate is provided. Required for verifying self-signed TLS certificates.

secureJsonData:
  password: secureExamplePassword # the password used for authentication.

  tlsCACert:     <string> # TLS CA certificate
  tlsClientCert: <string> # TLS client certificate
  tlsClientKey:  <string> # TLS client key
请注意,从 UI 保存配置时,系统会自动添加一个 version 属性。该属性显示保存此配置时所使用的插件版本。
HTTP 协议
如果选择通过 HTTP 协议连接,则会显示更多设置选项。
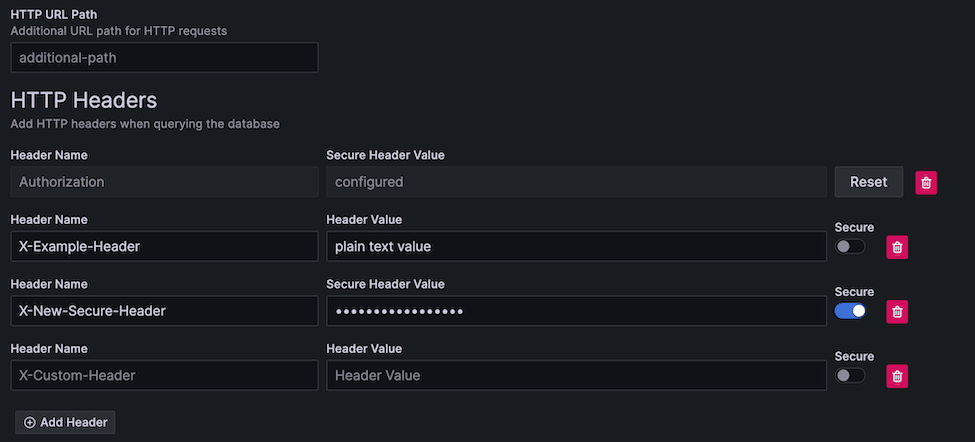
HTTP 路径
如果 HTTP 服务器通过其他 URL 路径对外提供服务,可以在此处添加。
jsonData:
  # 不包含开头的斜杠
  path: additional/path/example
自定义 HTTP 请求头
你可以为发送到服务器的请求添加自定义请求头。
请求头可以是明文,也可以是安全值。
所有请求头键都会以明文形式存储,而安全请求头值会保存在安全配置中 (类似于 password 字段) 。
明文/安全请求头的 YAML 示例:
jsonData:
  httpHeaders:
  - name: X-Example-Plain-Header
    value: plain text value
    secure: false
  - name: X-Example-Secure-Header
    # 不包含 "value"
    secure: true
secureJsonData:
  secureHttpHeaders.X-Example-Secure-Header: secure header value
其他设置
这些附加设置为可选项。
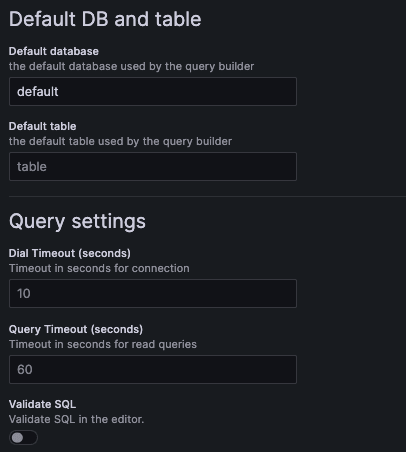
示例 YAML:
jsonData:
  defaultDatabase: default # default database loaded by the query builder. Defaults to "default".
  defaultTable: <string>   # default table loaded by the query builder.

  dialTimeout: 10    # dial timeout when connecting to the server, in seconds. Defaults to "10".
  queryTimeout: 60   # query timeout when running a query, in seconds. Defaults to 60. This requires permissions on the user, if you get a permission error try setting it to "0" to disable it.
  validateSql: false # when set to true, will validate the SQL in the SQL editor.
OpenTelemetry
OpenTelemetry (OTel) 已深度集成到此插件中。 OpenTelemetry 数据可通过我们的 exporter 插件 导出到 ClickHouse。 为获得最佳效果,建议同时为 日志 和 链路追踪 配置 OTel。
此外,还必须配置这些默认值,以启用 数据链接;这项功能可支持强大的可观测性工作流。
日志
为加快日志查询构建速度,您可以为日志查询设置默认数据库/表以及列。这样会在 query builder 中预加载一个可直接运行的日志查询,从而加快在 Explore 页面中的可观测性浏览。
如果您使用 OpenTelemetry,应该启用“Use OTel”开关,并将 default log table 设置为 otel_logs。
这会自动覆盖默认列,以使用所选的 OTel schema 版本。
虽然日志并不要求必须使用 OpenTelemetry,但使用统一的日志/trace 数据集有助于借助数据链接实现更流畅的可观测性工作流。
日志配置界面示例:
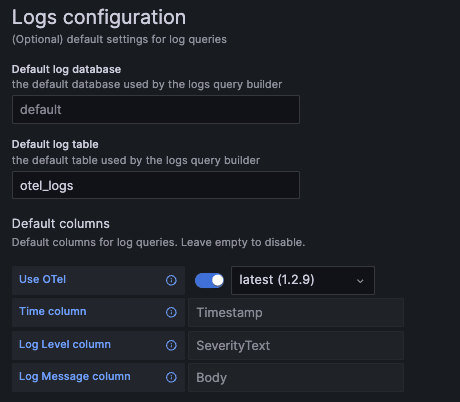
日志配置 YAML 示例:
jsonData:
  logs:
    defaultDatabase: default # default log database.
    defaultTable: otel_logs  # default log table. If you're using OTel, this should be set to "otel_logs".

    otelEnabled: false  # set to true if OTel is enabled.
    otelVersion: latest # the otel collector schema version to be used. Versions are displayed in the UI, but "latest" will use latest available version in the plugin.

    # Default columns to be selected when opening a new log query. Will be ignored if OTel is enabled.
    timeColumn:       <string> # the primary time column for the log.
    levelColumn:   <string> # the log level/severity of the log. Values typically look like "INFO", "error", or "Debug".
    messageColumn: <string> # the log's message/content.
链路追踪
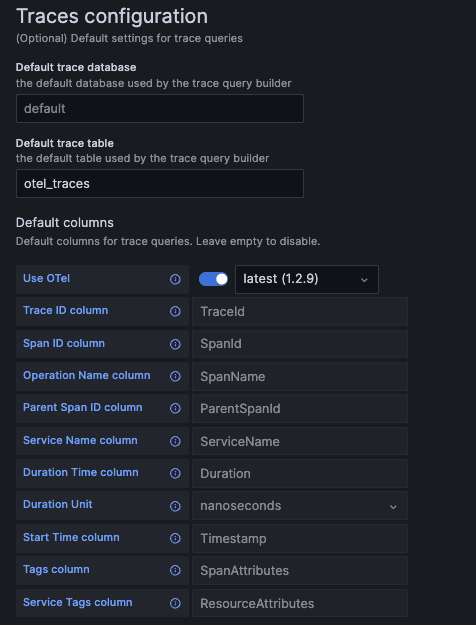
为加快链路追踪查询构建,你可以为 trace 查询设置默认的数据库/表以及列。这样会为 query builder 预加载一条可直接运行的 trace 搜索查询,从而加快在 Explore 页面中浏览可观测性数据的速度。
如果你使用 OpenTelemetry,建议启用“Use OTel”开关,并将默认 trace 表设置为 otel_traces。
这样会自动覆盖默认列,以使用所选的 OTel schema 版本。
虽然并非必须使用 OpenTelemetry,但如果链路追踪采用其 schema,此功能效果最佳。
链路追踪配置界面示例:
链路追踪配置 YAML 示例:
jsonData:
  traces:
    defaultDatabase: default  # default trace database.
    defaultTable: otel_traces # default trace table. If you're using OTel, this should be set to "otel_traces".

    otelEnabled: false  # set to true if OTel is enabled.
    otelVersion: latest # the otel collector schema version to be used. Versions are displayed in the UI, but "latest" will use latest available version in the plugin.

    # Default columns to be selected when opening a new trace query. Will be ignored if OTel is enabled.
    traceIdColumn:       <string>    # trace ID column.
    spanIdColumn:        <string>    # span ID column.
    operationNameColumn: <string>    # operation name column.
    parentSpanIdColumn:  <string>    # parent span ID column.
    serviceNameColumn:   <string>    # service name column.
    durationTimeColumn:  <string>    # duration time column.
    durationUnitColumn:  <time unit> # duration time unit. Can be set to "seconds", "milliseconds", "microseconds", or "nanoseconds". For OTel the default is "nanoseconds".
    startTimeColumn:     <string>    # start time column. This is the primary time column for the trace span.
    tagsColumn:          <string>    # tags column. This is expected to be a map type.
    serviceTagsColumn:   <string>    # service tags column. This is expected to be a map type.
列别名
列别名是一种便捷方式,让你能够使用不同的名称和类型来查询数据。 借助别名,你可以将嵌套的 schema 展平,从而在 Grafana 中更轻松地进行选择。
在以下情况下,别名功能可能对你特别有用:
- 你了解自己的 schema 及其大部分嵌套属性/类型
- 你将数据存储为 Map 类型
- 你将 JSON 以字符串形式存储
- 你经常使用函数来转换所选的列
在表中定义的 ALIAS 列
ClickHouse 内置了列别名功能,并且可开箱即用地与 Grafana 配合使用。 别名列可以直接在表中定义。
CREATE TABLE alias_example (
  TimestampNanos DateTime(9),
  TimestampDate ALIAS toDate(TimestampNanos)
)
在上述示例中,我们创建了一个名为 TimestampDate 的别名,用于将纳秒级时间戳转换为 Date 类型。
这些数据不会像第一列那样存储在磁盘上,而是在查询时计算得出。
表中定义的别名不会随 SELECT * 一起返回,但可以在服务器设置中进行配置。
如需了解更多信息,请参阅 ALIAS 列类型的文档。
列别名表
默认情况下,Grafana 会根据 DESC table 的返回结果提供列建议。
在某些情况下,你可能希望完全覆盖 Grafana 能看到的列。
这样可以在 Grafana 选择列时隐藏你的 schema;根据表的复杂程度,这可能有助于改善用户体验。
相比在表中直接定义别名,这种方式的好处是你可以轻松更新这些别名,而无需修改表。在某些 schema 中,这类定义可能长达数千项,从而让底层表定义显得杂乱。它还可以隐藏你希望用户忽略的列。
Grafana 要求别名表具有以下列结构:
CREATE TABLE aliases (
  `alias` String,  -- The name of the alias, as seen in the Grafana column selector
  `select` String, -- The SELECT syntax to use in the SQL generator
  `type` String    -- The type of the resulting column, so the plugin can modify the UI options to match the data type.
)
下面介绍如何使用别名表来复现 ALIAS 列的行为:
CREATE TABLE example_table (
  TimestampNanos DateTime(9)
);

CREATE TABLE example_table_aliases (`alias` String, `select` String, `type` String);

INSERT INTO example_table_aliases (`alias`, `select`, `type`) VALUES
('TimestampNanos', 'TimestampNanos', 'DateTime(9)'), -- Preserve original column from table (optional)
('TimestampDate', 'toDate(TimestampNanos)', 'Date'); -- Add new column that converts TimestampNanos to a Date
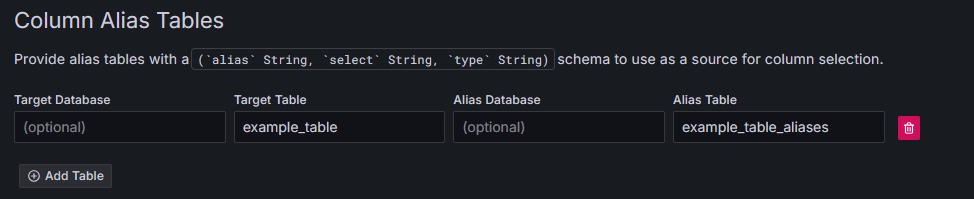
然后,我们就可以将此表配置为供 Grafana 使用。请注意,这个名称可以随意指定,甚至可以在单独的数据库中定义:
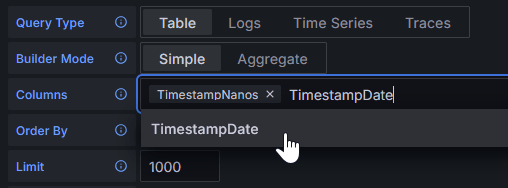
现在,Grafana 看到的将是别名表的结果,而不是 DESC example_table 的结果:
这两种别名方式都可用于执行复杂的类型转换或提取 JSON 字段。
所有 YAML 选项
以下是该插件提供的全部 YAML 配置选项。 部分字段给出了示例值,其他字段则仅显示字段类型。
有关使用 YAML 配置数据源的更多信息,请参阅 Grafana 文档。
datasources:
  - name: Example ClickHouse
    uid: clickhouse-example
    type: grafana-clickhouse-datasource
    jsonData:
      host: 127.0.0.1
      port: 9000
      protocol: native
      secure: false
      username: default
      tlsSkipVerify: <boolean>
      tlsAuth: <boolean>
      tlsAuthWithCACert: <boolean>
      defaultDatabase: default
      defaultTable: <string>
      dialTimeout: 10
      queryTimeout: 60
      validateSql: false
      httpHeaders:
      - name: X-Example-Plain-Header
        value: plain text value
        secure: false
      - name: X-Example-Secure-Header
        secure: true
      logs:
        defaultDatabase: default
        defaultTable: otel_logs
        otelEnabled: false
        otelVersion: latest
        timeColumn: <string>
        levelColumn: <string>
        messageColumn: <string>
      traces:
        defaultDatabase: default
        defaultTable: otel_traces
        otelEnabled: false
        otelVersion: latest
        traceIdColumn: <string>
        spanIdColumn: <string>
        operationNameColumn: <string>
        parentSpanIdColumn: <string>
        serviceNameColumn: <string>
        durationTimeColumn: <string>
        durationUnitColumn: <time unit>
        startTimeColumn: <string>
        tagsColumn: <string>
        serviceTagsColumn: <string>
    secureJsonData:
      tlsCACert:     <string>
      tlsClientCert: <string>
      tlsClientKey:  <string>
      secureHttpHeaders.X-Example-Secure-Header: secure header value